RedisMQ Dashboard
- Navigate to MQ monitoring on the left pane in the Rakuten Sixthsense portal.
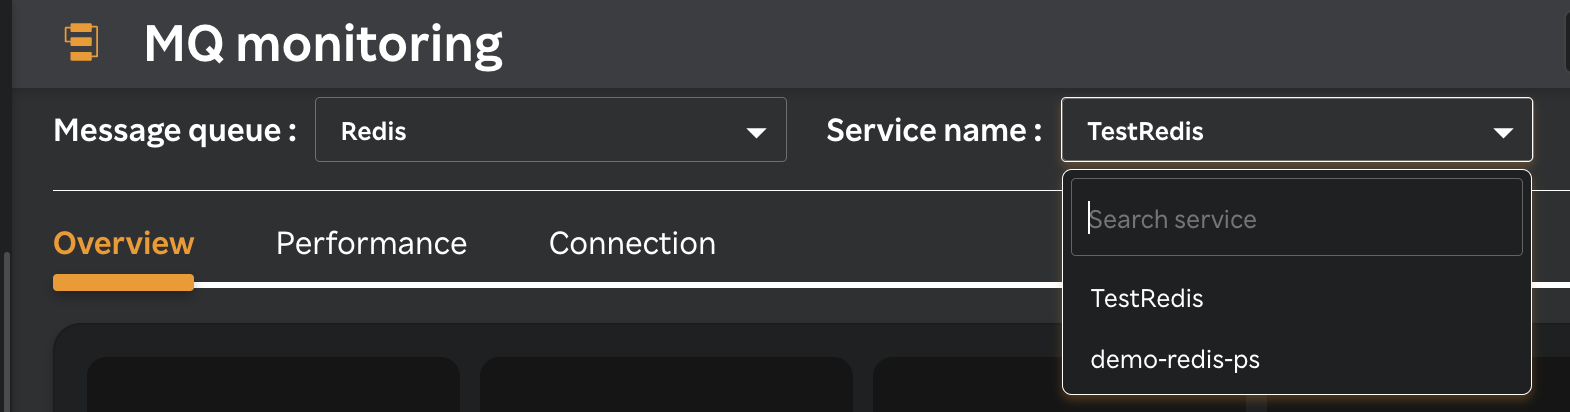
- Select Redis from the Message queue drop-down.
- Select a service from the Service name drop-down list as in the following screen.
A screen similar to the following is displayed.

The top pane displays the following metrics and you can view total number of the various Redis concepts at a glance.
| Metric Name | Type | Description | Listed in Tab |
|---|---|---|---|
| Total Connections | GAUGE | Number of currently connected clients | Overview |
| Total Commands | DIFF | Delta of total commands processed | Overview |
| Connection Usage (%) | GAUGE | % of connections used (connected_clients / maxclients) | Overview |
| Last Chances (bytes) | GAUGE | Maximum of recent input/output buffers per client | Overview |
| Blocked Clients | GAUGE | Number of clients blocked on commands | Overview |
| Rejected Connections | DIFF | Delta of rejected connections | Overview |
| Connected Blocked Clients | GAUGE | Number of clients blocked | Overview |
| Expired Keys | GAUGE | Number of keys with TTL | Overview |
| Non Expired Keys | GAUGE | Number of keys without TTL | Overview |
| Total no of keys | GAUGE | Total keys across all Redis databases | Overview |
| Command per sec | GAUGE | Commands processed per second | Overview |
| Evicted Objects | DIFF | Delta of keys evicted due to memory limits | Overview |
| Expired Objects | DIFF | Delta of keys expired | Overview |
| CPU Usage (%) | RATE | Sum of system + user CPU usage % | Performance |
| Response Time | GAUGE | Ping latency to Redis instance (ms) | Performance |
| Network In | DIFF | Delta of network input bytes | Performance |
| Network Out | DIFF | Delta of network output bytes | Performance |
| Latency | GAUGE | Event loop latency (ms) | Performance |
| Cache Hit Ratio | GAUGE | Cache hit ratio % (hits / (hits + misses)) | Performance |
| Evictions | DIFF | Delta of evicted keys | Performance |
| Client Input Buffer | GAUGE | Maximum recent input buffer per client | Performance |
| Fragmentation Ratio | GAUGE | Memory fragmentation ratio | Performance |
| Used Memory (%) | GAUGE | Percentage of used memory vs total system memory | Performance |
| Active Connections | GAUGE | Connected clients minus blocked clients | Connection |
| Blocked Connections | GAUGE | Number of clients blocked on commands | Connection |
| Rejected Connections | DIFF | Delta of rejected connections | Connection |
| Connected Client | GAUGE | Number of currently connected clients | Connection |
| Connected Slaves | GAUGE | Number of connected Redis replicas | Connection |
| Client Input Buffer | GAUGE | Maximum recent input buffer per client | Connection |
| Client Output List | GAUGE | Maximum recent output buffer per client | Connection |
| Keyspace misses | DIFF | Delta of keyspace misses | Connection |
| Master link down since seconds | GAUGE | Time in seconds since master link went down | Connection |
| Connected Replicas | GAUGE | Connected Redis replicas count | Connection |
| Error | DIFF | Delta of general Redis errors | Connection |
| No Auth Error | DIFF | Delta of authentication errors | Connection |
note
The above metrics calculate changes over time
- DIFF - Shows the difference between two collection intervals
- RATE - Measures per-second change (e.g., CPU percentage)