Performance metrics
- Navigate to APM > Dashboard > Instance.
- Click on an instance name under the Name column.
- Click the Performance tab. The following widgets are displayed.
note
The Performance tab displays the metric graphs for all applications.
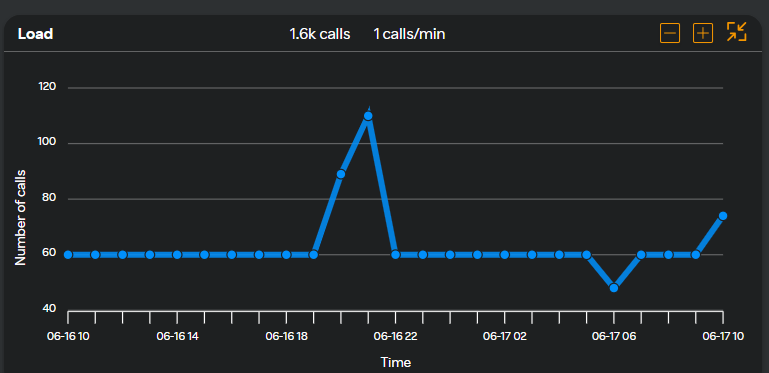
Load
The Load widget displays a graph of the number of calls the instance received during a particular period. Click on any point in the graph to view calls the instance received. Following is a sample screen.
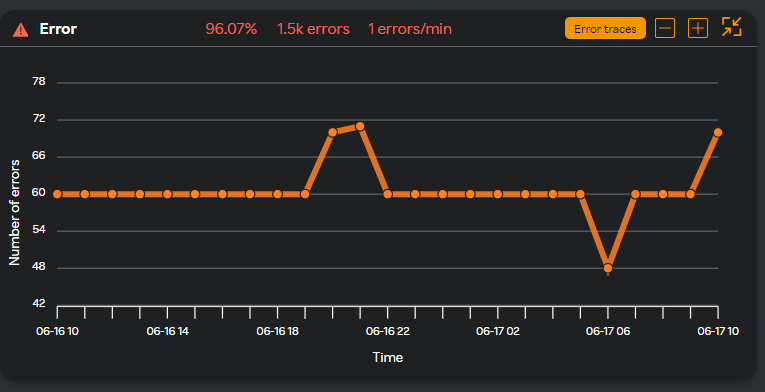
Error
The Error widget displays a graph of the number of errors occurring on the instance during a particular period. Click on any point in the graph to view the number of errors.
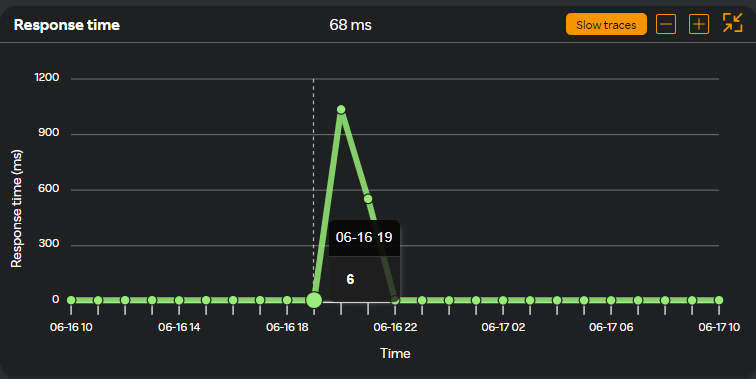
Response time
The Response Time widget displays the response time of an instance during a particular period.
Click Slow Traces in the Response Time widget to view the list of instances that are slow.
Complete trace level details are displayed in the Trace window to identify the errors and fix them. For more information about the Trace window, see Trace.
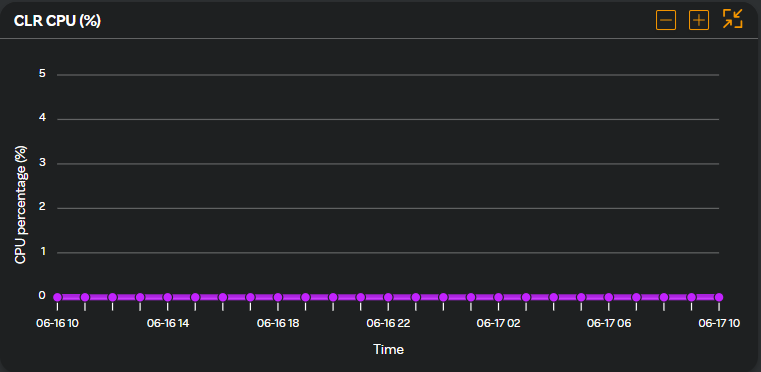
CLR CPU (%)
The CLR CPU widget displays the CPU usage by the Common Language Runtime (CLR). Monitoring CLR CPU usage helps in understanding how much of the CPU resources are being consumed by the managed code of the .NET application. The graph represents the CPU usage in percentage during a selected time period.
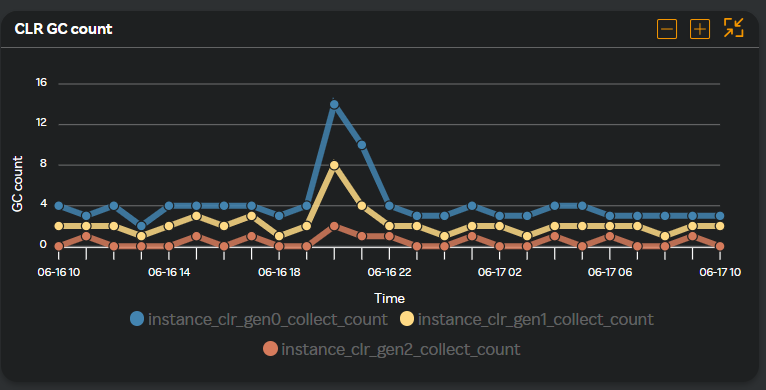
CLR GC count
The CLR GC count widget displays the number of garbage collection (GC) events that have occurred in the Common Language Runtime (CLR). The graph represents the number of GC in instances during a selected time period.
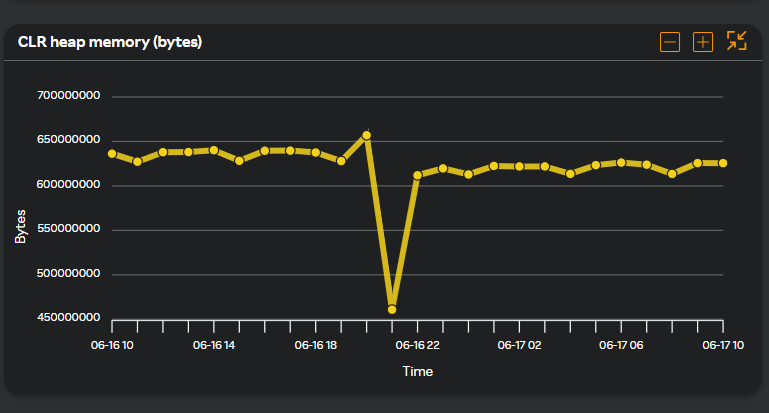
CLR heap memory (bytes)
The CLR heap memory widget is the memory used by the Common Language Runtime (CLR) to store managed objects. The graph represents the heap memory used during a selected time period.
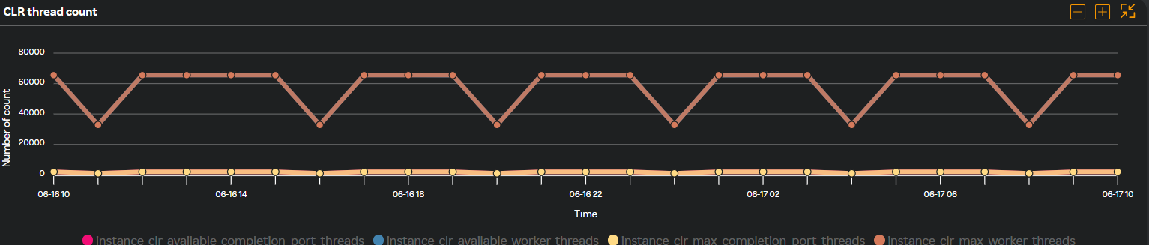
CLR thread count
The CLR thread count widget is the number of threads that are currently being managed by the Common Language Runtime (CLR). Monitoring CLR thread count helps you understand the threading behavior of your application. The graph displays the number of treads used during a selected time period.
note
You can expand, contract, and reset the view to the default timeline by clicking the icons available on the top right corner of the above widgets. For more information about performing various actions, see Working with a widget.