MySQL
Use the following procedure for monitoring the MySQL database.
- Navigate to Database monitoring on the left pane.
- Select MySQL from the Select database type drop-down list.
- Select a service from the Select service drop-down list.
- Select a cluster from the Select cluster drop-down list.
- Select a node from the Select node drop-down list.
The following screen appears along with the various available tabs.
Database hardware
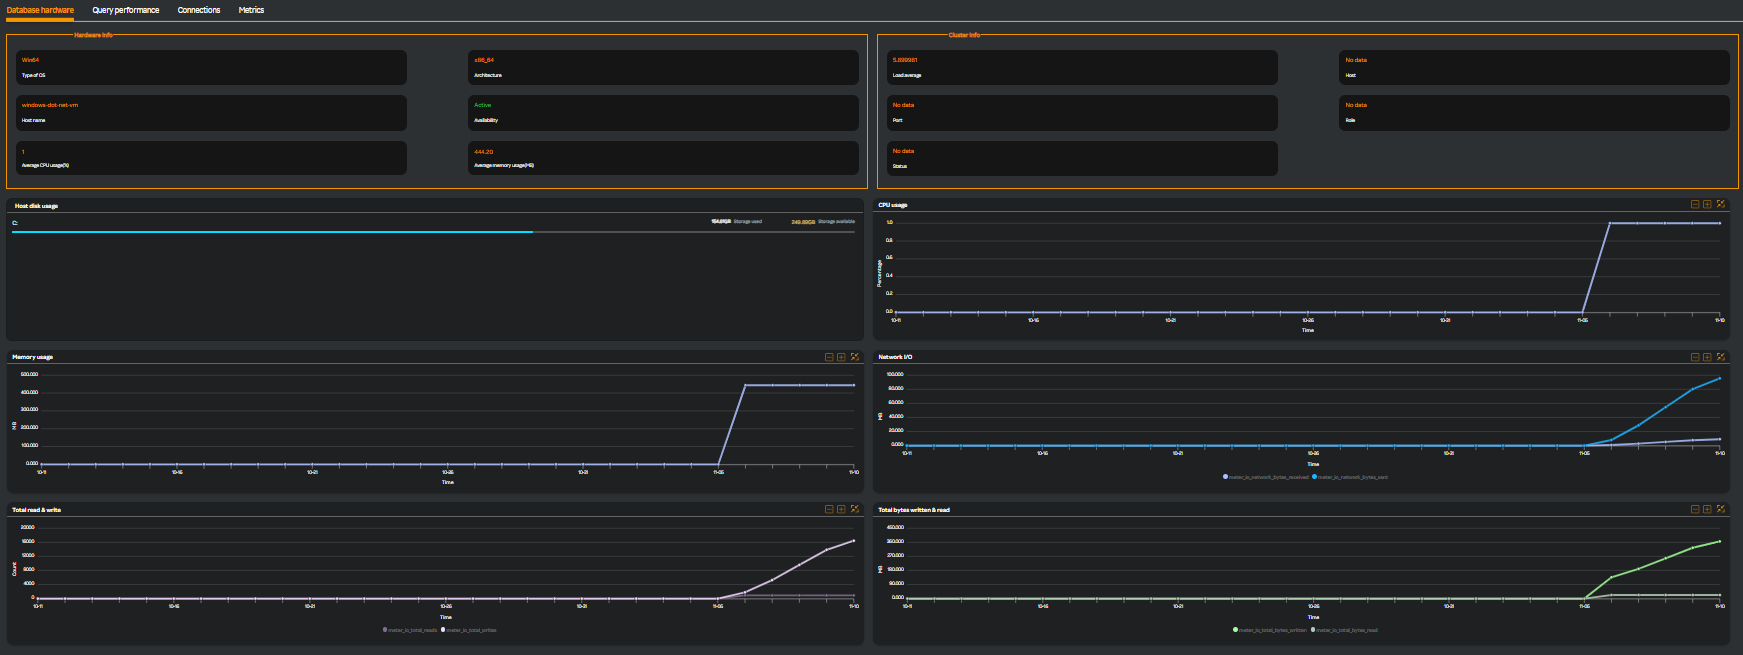
The Database hardware tab is selected by default. The following widgets are displayed.
| Metric Name | Description |
|---|---|
| Host disk usage | Disk usage of the host machine where the DB server is running. Monitoring host disk usage helps ensure that your MySQL server's data files, logs, and backup files have enough space. This is crucial for maintaining high availability and optimal performance of your MySQL databases. |
| CPU usage | Percentage CPU usage of the DB server in the host machine (Value is zero if the connection is remote or is installed in docker container). High CPU usage indicates performance bottlenecks in the database. Monitoring this metric identifies processes consuming excess CPU resources, pinpoint inefficient queries that may need optimization and so on. It is essential for maintaining optimal performance, ensuring resource efficiency, troubleshooting issues, and enhancing user experience. |
| Memory usage | Total memory allocated (being used) by DB server. Monitoring the memory usage is essential for maintaining optimal performance, ensuring resource efficiency, troubleshooting issues, and enhancing user experience. By implementing effective monitoring practices, database administrators can proactively manage their SQL Server instances and ensure they meet both current and future demands. |
| Network I/O | Total bytes received and sent by DB server(represented in MB). Refers to the amount of data transmitted between the database server and client applications or other servers over a network. This metric ensures that database administrators can detect network-related performance issues early, take proactive steps to optimize resource utilization, and maintain a high-performance SQL Server environment. |
| Total read & write | No. of times DB server read and written from the files (count value). Refers to the cumulative amount of data that has been read and written from disk or memory by the database management system (DBMS). Database administrators can gain a clearer picture of database I/O activity, identify inefficient queries, and ensure optimal performance of the SQL Server instance. |
| Total bytes written & read | Total bytes written and read by DB server (represented in bytes). Refers to the cumulative amount of data that has been written and read to disk by the database management system (DBMS). It is crucial for maintaining optimal performance, ensuring resource efficiency, troubleshooting issues, and enhance data integrity. By implementing effective monitoring practices, database administrators can proactively manage their SQL Server instances and ensure they meet both current and future demands. |
| Cache Hit Ratio | Cache hit ratio at both DB and Linux levels. |
| DB Uptime | Overall database uptime. |
| DB downtime | Overall database downtime. |
Query performance
Clicking the Query Performance tab and selecting the threshold from the Query threshold drop-down list displays the following screen.
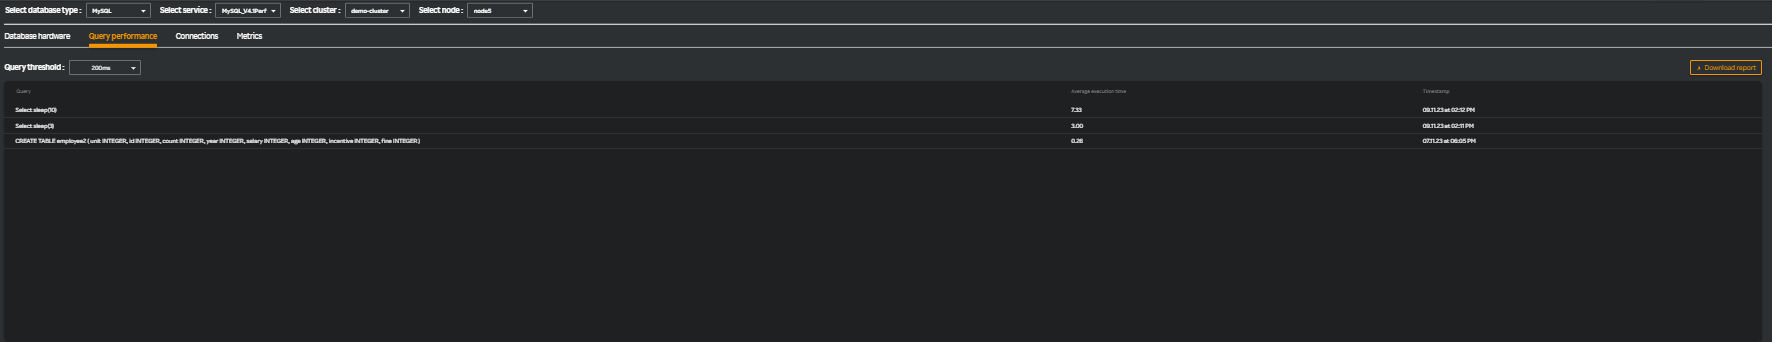
Monitoring query performance ensures that database queries execute quickly, which directly impacts the speed and responsiveness of your applications. These metrics helps prevent performance degradation and supports continuous improvement of your database applications.
note
You can download the Query Performance table in PDF format by clicking the  icon. Only the top 100 entries are downloaded if there are more than 100 entries for downloading.
Connections
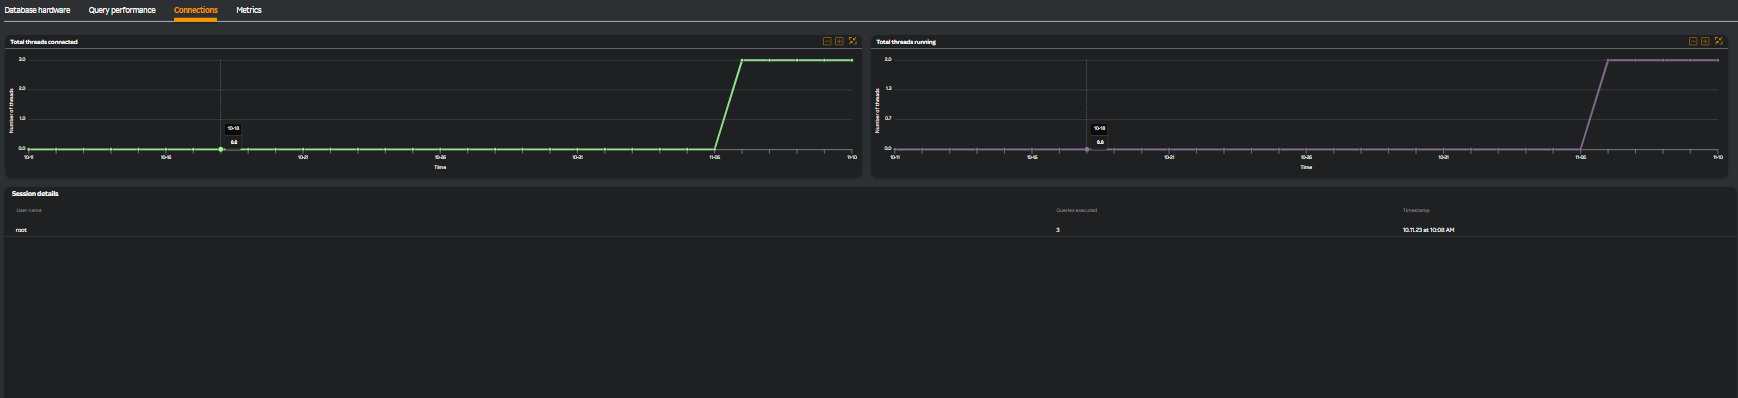
Clicking the Connections tab displays the following widgets as in the following screen.
| MEtric Name | Description |
|---|---|
| Total threads connected | Represents the total connections to the DB server (Count). This helps you manage and optimize workload, detect connection anomalies early, efficiently allocate resources, and support the scalability of your environment |
| Total threads running | Represents the total active connections to the DB server (Count). Database administrators gain critical insights into the server's current workload, enables detecting bottlenecks early, optimize resource allocation, and plan for future growth. |
| Session details | Details of all unique users, number of queries the user is currently running, and last active time of the user. This provides administrators with a deep understanding of user activity, helps diagnose performance issues, optimizes resource usage, strengthens security, and supports long‐term capacity planning. |
| Active Connections | Total active connections. |
| Failed Connections | Total failed connections. |
| All Connection Types | Includes various connection types. |
Metrics
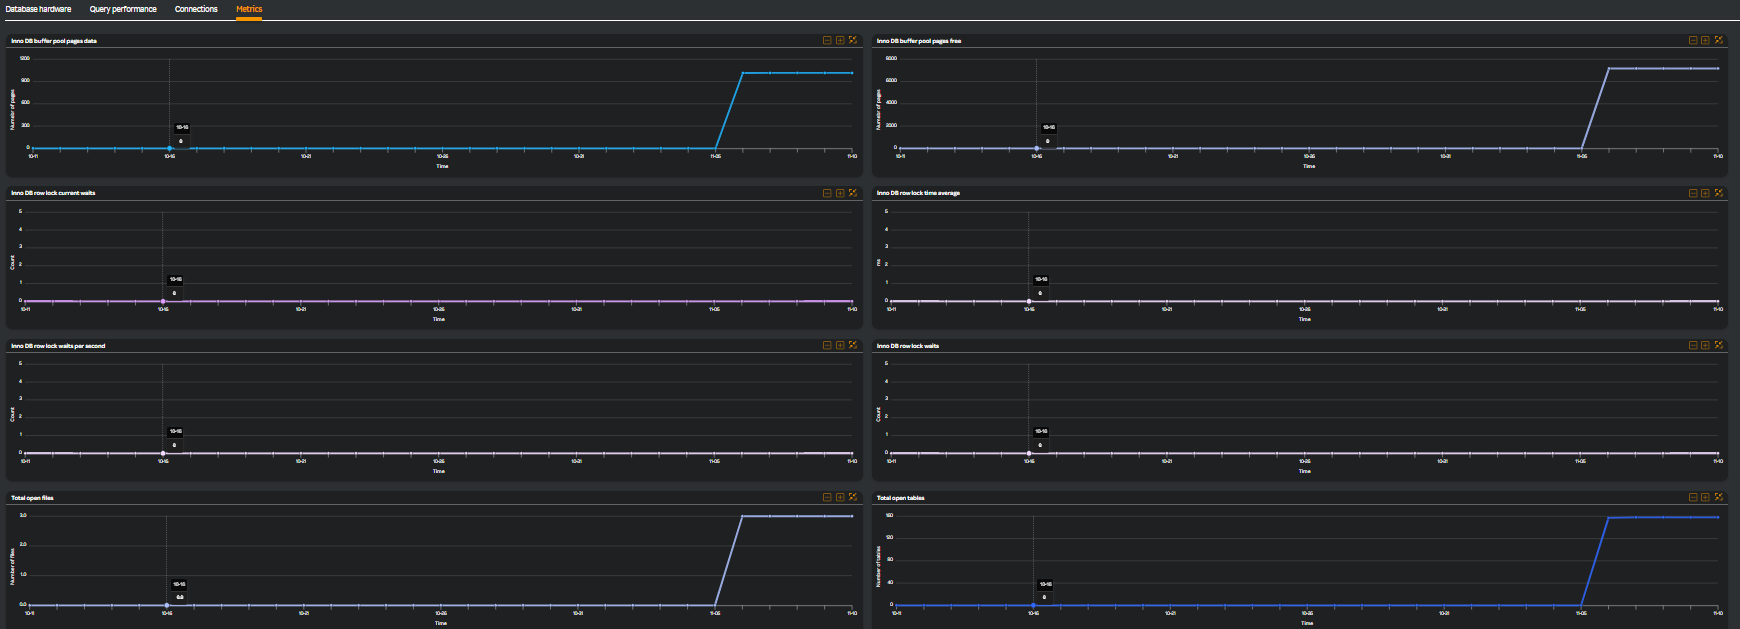
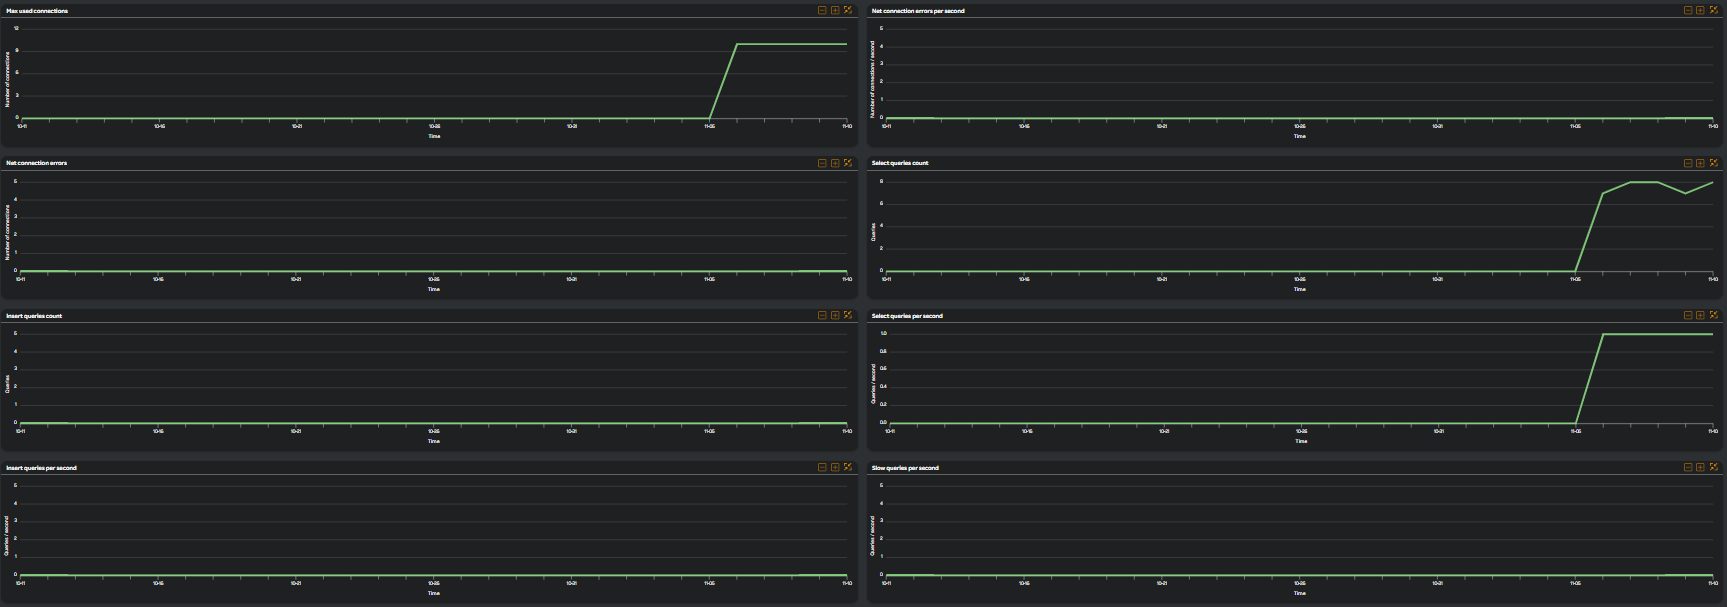
Clicking the Metrics tab displays the following widgets.
| Metric Name | Description |
|---|---|
| Inno DB buffer pool pages data | This widget is a graph widget which displays the Inno DB buffer pool pages of the selected node. It represents the amount of data (in bytes) currently held in the InnoDB buffer pool. This metric is crucial as it provides insights into how effectively your MySQL server caches data, reduces disk I/O, and meets the demands of your workload. |
| Inno DB buffer pool pages free | This widget is a graph widget which displays the Inno DB buffer pool pages freed from memory of the selected node. Monitoring the number of free pages in the InnoDB buffer pool is vital because it directly reflects your MySQL server's ability to efficiently cache data, minimize disk I/O, and maintain high query performance. |
| Inno DB row lock current waits | This widget is a graph widget which displays the Inno DB row lock current waits of the selected node. Administrators gain critical insights into transaction contention and can proactively optimize query performance, reduce latency, and maintain high system throughput in MySQL environments. |
| Inno DB row lock time average | This widget is a graph widget which displays the Inno DB row lock time average of the selected node. This metric helps in optimizing queries and database design, ensuring that transactions execute efficiently, which contributes to better overall performance and scalability of your MySQL environment. |
| Inno DB row lock waits per second | This widget is a graph widget which displays the Inno DB row lock waits per second of the selected node. This metric helps gain critical insights into lock contention, helping you optimize query performance, troubleshoot performance bottlenecks, and plan for future growth. |
| Total open files | This widget is a graph widget which displays the total open files of the selected node. Administrators can ensure that MySQL efficiently manages its file descriptors, avoid resource exhaustion, and maintain optimal database performance. |
| Total open tables | This widget is a graph widget which displays the total open tables that are currently open in the selected node. This metric provides insights into resource utilization, helps detect configuration issues, and supports performance optimization and is a key factor in ensuring that table caching is appropriately managed. |
| Table locks waited per second | This widget is a graph widget which displays the number of times per second that queries had to wait for a table lock to be released before they could proceed. This metric provides critical insights into locking behaviors and contention issues. This data enables you to optimize query design, reduce performance bottlenecks, and plan for future capacity. |
| Max connection errors per second | This widget is a graph widget which displays the maximum connection errors per second of the selected node. Monitoring this metric is essential to prevent connection blocking, diagnose network or configuration issues early, and maintain a stable, high-performing MySQL environment. |
| Max used connections | This widget is a graph widget which displays the maximum connections used of the selected node. Monitoring this metric provides a clear benchmark on how many connections your system handles at peak times. |
| Insert queries per second | This widget is a graph widget which displays the inserted queries per second of the selected node. This metric provides insight into your system's write workload, helps detect performance anomalies early, and supports capacity planning. |
| Select queries per second | This widget is a graph widget which displays the selected queries per second of the selected node. As an administrator, you gain a detailed view of how your MySQL server handles read operations, empowering proactive performance tuning, effective resource management, and smoother user experiences. |
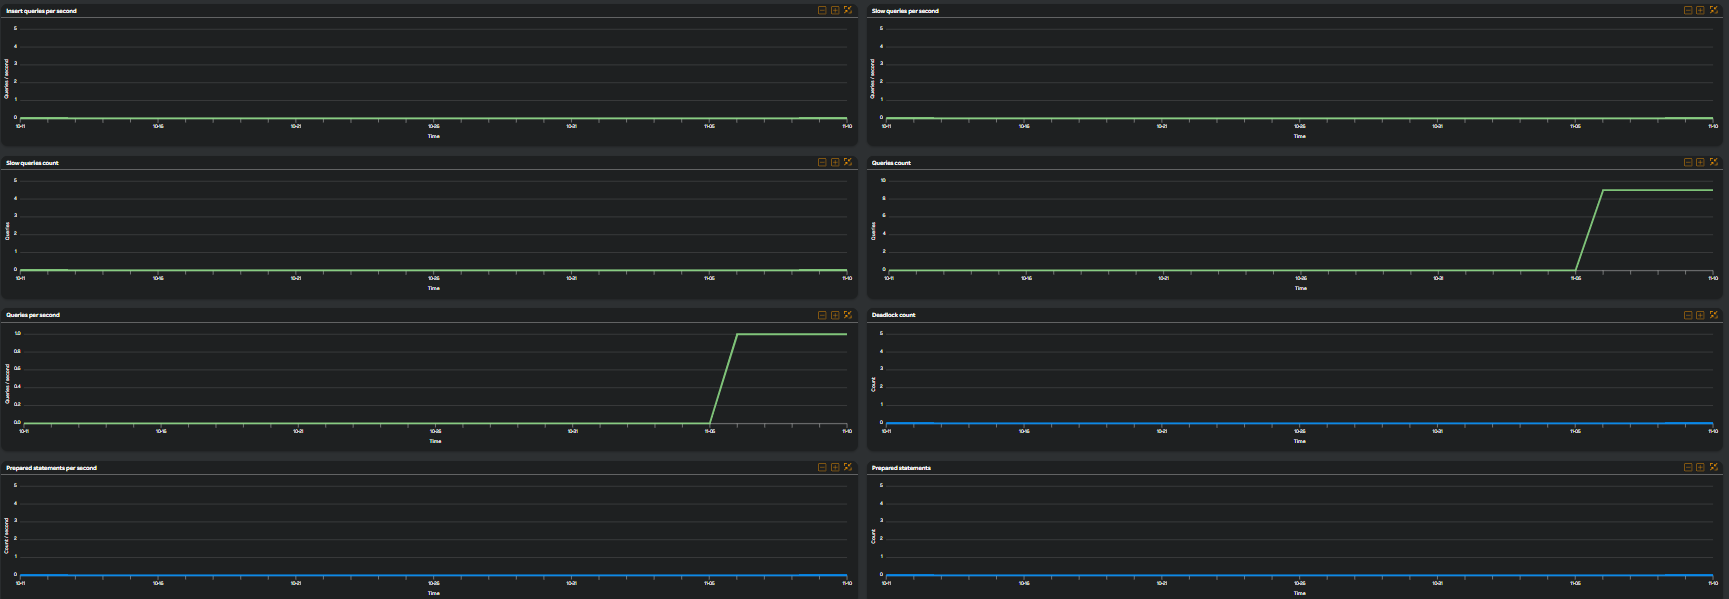
| Prepared stmt count per second | This widget is a graph widget which displays the prepared statement count per second of the selected node. As an administrator, you gain critical insights into how efficiently your applications use SQL statement preparation, which helps optimize performance, prevent resource leaks, and ensure your MySQL server scales effectively to handle increasing loads. |
| Queries per second | This widget is a graph widget which displays the queries per second of the selected node. This metric helps in understanding workload, optimizing performance, and ensuring your database scales effectively. |
| Slow queries per second | This widget is a graph widget which displays the slow queries per second of the selected node. This metric is critical for identifying performance issues early, optimizing queries and resource usage, and ultimately ensuring a high-performing and scalable database environment. |
| Total threads connected | This widget is a graph widget which displays the total threads connected of the selected node. This metric provides insight into current user activity and system load, aids in detecting connection issues early, and supports effective resource management. |
| Total threads running | This widget is a graph widget which displays the total threads running of the selected node. This metric helps gain critical insights into the system's active workload, detect performance issues early, optimize resource usage, and support future capacity planning. |
| Database time | Time taken by the database at the transaction level, including successes, failures, and timeouts. |
| Total transactions | Total number of transactions. |
| Average Transaction Rate | Average rate of transactions per unit time. |
| Index Hit Ratio | Measures how often queries use indexes. |
| Unused Indexes | Find indexes that haven't been used. |
| Index Read Operations | Number of times MySQL reads a row using an index. |
| Sequential Row Reads | Number of index range scans. |
| Random Row Reads | Number of times MySQL reads a row without using an index. |
Security
The following security metrics are available on the dashboard.
| Metric Name | Description |
|---|---|
| Failed Logins | Logs unsuccessful login attempts. |
| Security - Delete and DML Operations | Monitor any Delete table and Database operations. |
| auth_failed_count | The total number of unsuccessful authentications. |
| auth_success_count | The total number of successful authentications. |
Multi-column Filter
Query performance
- Multi-column filter can be applied on numeric columns within the Query performance Table to refine the displayed data based on specific conditions.
- When the user clicks on the “Filter by” option, user can apply filter below numeric columns
| Column Name | Description |
|---|---|
| Maximum execution time (s) | The longest query execution time recorded in seconds. |
| Maximum execution timestamp | Date and time when the longest-running query was recorded. |
- Each filter condition is applied using the below operators and value ( user input based on the unit)
| Operator |
|---|
| Greater than |
| Less than |
| Equals |
| Greater than or equals |
| Less than or equals |
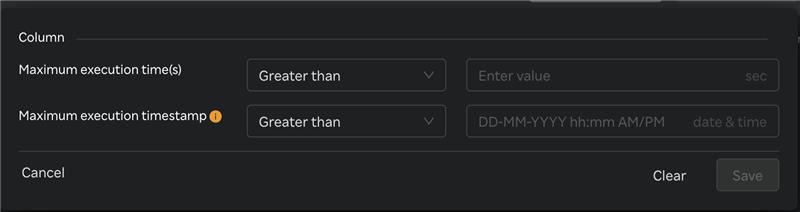
- Once filters & conditions are applied save button is enabled & click "Save" to apply the filter.
- Once filters & conditions are applied it displays no. of filters are applied.

note
- Filters are applied using AND logic — all specified conditions must be met for a record to be displayed.
- Only numeric columns support filtering; non-numeric fields (e.g., text or categorical values) are excluded from the filter options.
- When the Maximum Execution Timestamp (s) filter is applied, the system reviews each query in the table. If a query was executed within the time frame selected in the top-right corner, it displays that query’s maximum execution timestamp and maximum execution time.
- If no records match the selected filters, the table will display a message such as “No data".
- The multi-column filter state persists until the user clears filters by clicking on "Clear" button when Filter by button is clicked.
- A "Reset" button is available to clear all applied filters and restore the table to its original, unfiltered state. This button is enabled only when one or more filters are currently applied.

Connections --> Session details
- Multi-column filter can be applied on numeric columns within the Connections --> Session details Table to refine the displayed data based on specific conditions.
- When the user clicks on the “Filter by” option, user can apply filter below numeric columns
| Column Name | Description |
|---|---|
| Queries executed | Total number of queries executed during the session. |
| Timestamp | Date and time when the session activity was recorded. |
- Each filter condition is applied using the below operators and value ( user input based on the unit)
| Operator |
|---|
| Greater than |
| Less than |
| Equals |
| Greater than or equals |
| Less than or equals |
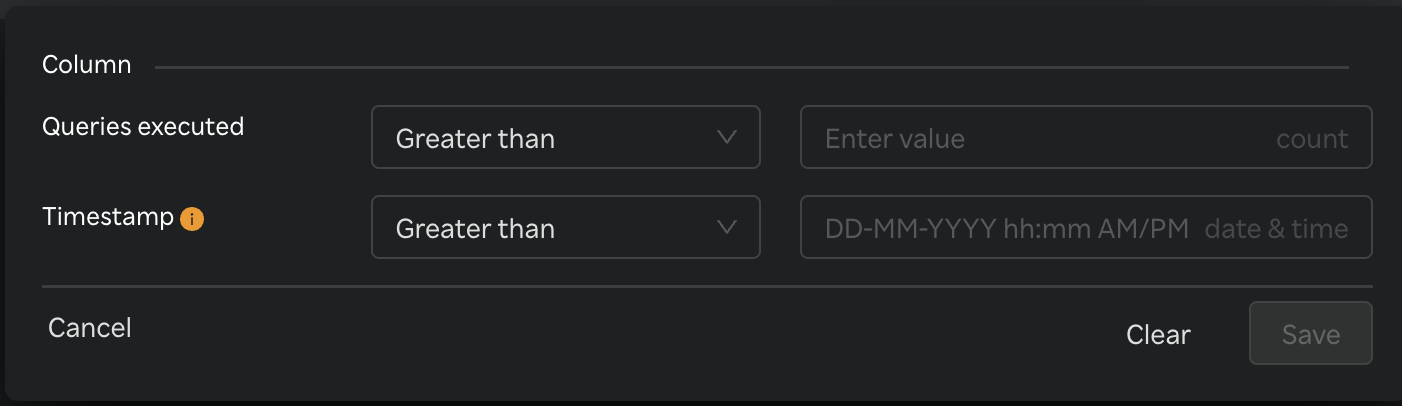
- Once filters & conditions are applied save button is enabled & click "Save" to apply the filter.
- Once filters & conditions are applied it displays no. of filters are applied.
note
- Filters are applied using AND logic — all specified conditions must be met for a record to be displayed.
- Only numeric columns support filtering; non-numeric fields (e.g., text or categorical values) are excluded from the filter options.
- If no records match the selected filters, the table will display a message such as “No data".
- The multi-column filter state persists until the user clears filters by clicking on "Clear" button when Filter by button is clicked.
- A "Reset" button is available to clear all applied filters and restore the table to its original, unfiltered state. This button is enabled only when one or more filters are currently applied.