Dashboards
Standard Dashboard
Logging in to your SixthSense Observability portal will take you to the home page where the standard dashboard is displayed by default similar to the following screen.
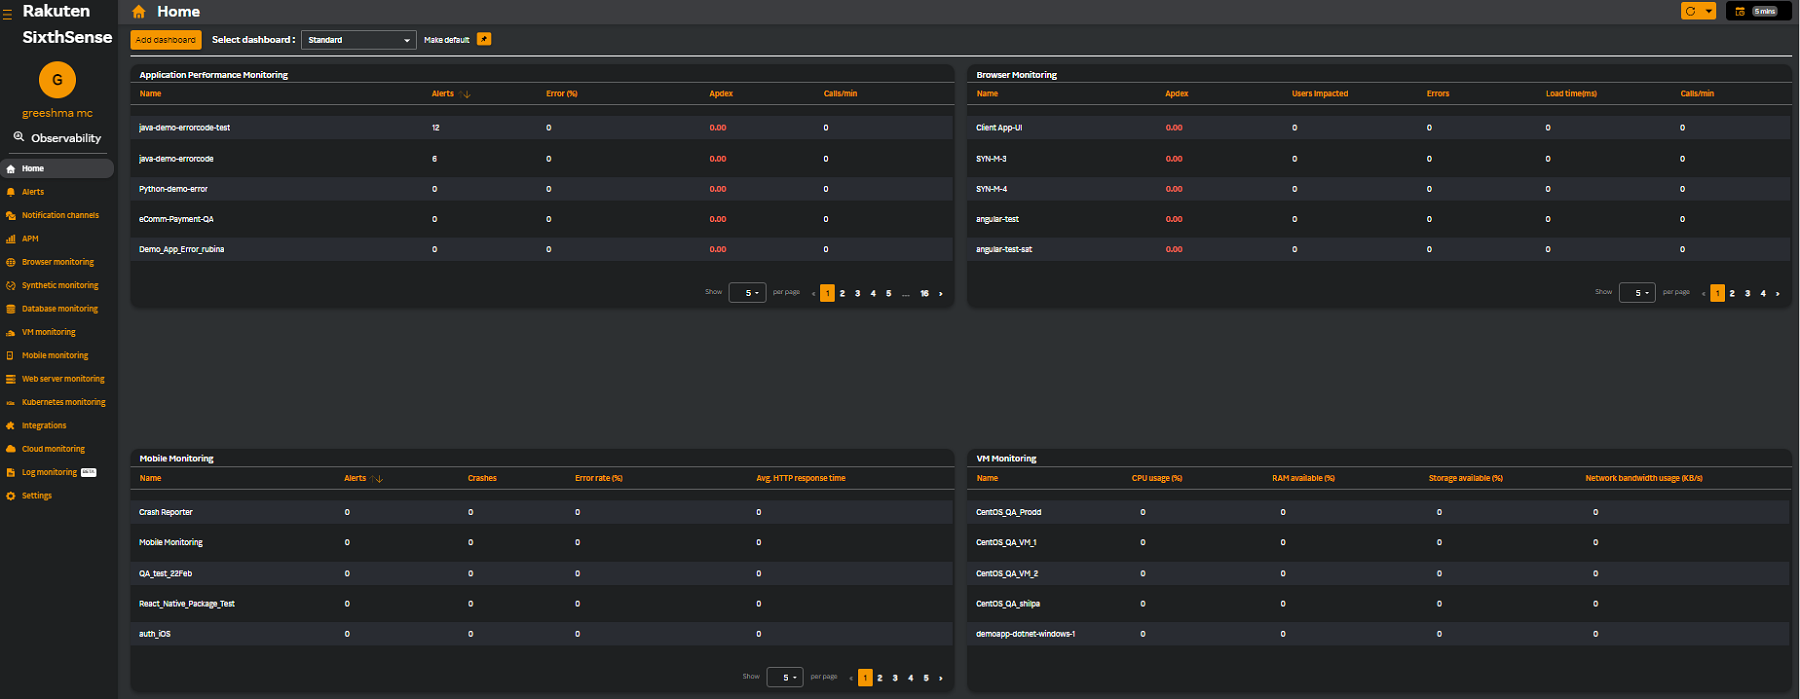
Working with a Standard Dashboard
Use the following to work your way through the dashboard.
| Icon | Action |
|---|---|
| | This is the home page when you login. Click this icon on the left pane from any other page to take you to the home page. |
 | Click this button to add a new dashboard. |
| Select dashboard: | The Standard dashboard is selected by default. The list of dashboards you have created are displayed here. The Standard Beta option in this drop-down list displays a new set of widgets. For more information, see Standard Dashboard Beta. Note: You can edit or delete the dashboards you have created from this drop-down list. |
| | Click this icon to make the dashboard you selected in the Select dashboard: drop down list as default. |
| | Click this icon to take you to the SixthSense Observability documentation. |
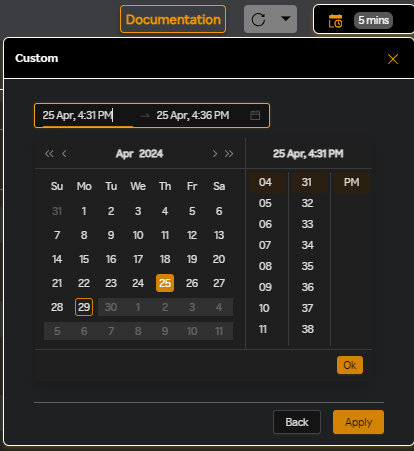
| | Select the time from the drop-down list for refreshing the data in the dashboards. |
 | Select the time range of the data you would like to view. You can also select Custom from the list and specify the From and To date and time to view data during the selected period as in the following screen. Click Apply to save the selection. |
| | The Compare icon helps SREs/DevOps to compare the performance after new deployment or upgrading an application. You can compare and understand the improvement or decrease in performance. For more information, see [Change comparison](#change-comparison. |
 | Each widget displays 5 rows per page. Click the  icon to view the next 5 icon to view the next 5 |

Change comparison
Role: SREs, Developers, Product Owners, or Administrators.
When comparing timelines between two time periods for metrics, the process typically involves analyzing data trends, patterns, and changes over time. You can specify two time periods that you want to compare and visualize them in graph format. You can analyze trends or patterns by looking at the increases or decreases in the metric graph header which is available only for single metric graphs.
The Compare drop-down list is available in the top right corner of the SixthSense AO portal with the following two options.
Compare previous period
- Select 1 week in the calendar.
- Select Compare previous period from the Compare drop-down list
For example, if the current date is 05/03/2025, you will see data from up to one week before this date i.e. from 19/02/2025 to 26/02/2025.

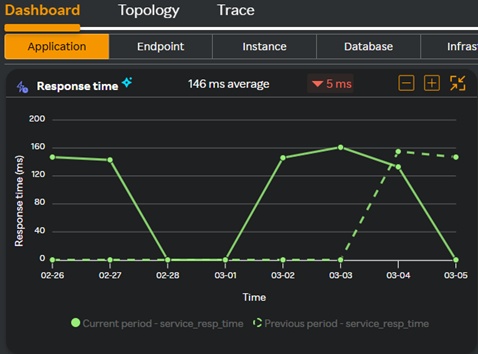
The Response time metric graph in the following screen displays two lines which shows comparison between the current period graph line and the previous period graph in dotted line. The difference of averages of current time period and the previous time period data. In the following screen it shows a decrease of 5 ms.
note
If you select 3 months duration Compare previous period option will be disabled as the maximum retention period is only 3 months.
Compare custom date
- Select 1 week in the calendar.
- Select Compare custom date.
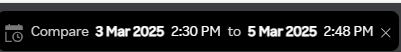
- Select the start date from the calendar displayed. For example 3 Mar 2025.
- Click Apply.
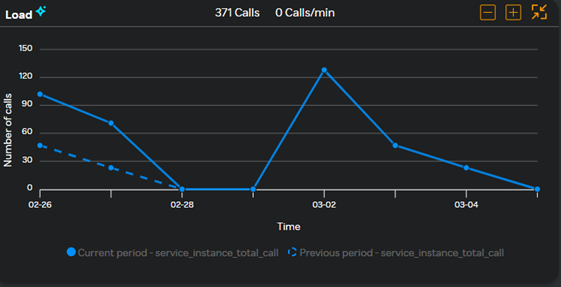
The Load metric graph in the following screen displays two lines which shows comparison between the current period graph line and the previous period graph in dotted line.
The date you selected for example, is 3 Mar 2025 2:30 PM and 1 week in the calendar. If the current date is 5 Mar 2025 2:48 PM, the graph will display only upto the current date as there is no data for the remaining 4 future days.
note
This feature is available only for APM, BM, MM, K8s, and VM.
Capability Dashboards
Following capability dashboards are available for you to comprehend at a glance when you select Standard Dashboard from the Select dashboard drop-down list.
Application Performance Monitoring
The APM dashboard displays the following metrics for your applications.
| Field | Description |
|---|---|
| Name | Application name |
| | If enabled, APM infra correlation is present for this application. Clicking this icon will take you to the Infrastructure details page for the selected instance. |
| Alerts | Number of alerts the application receives. |
| Error% | Percentage of errors occurring on a particular application. |
| Apdex | Apdex score calculated based on the performance of the application. |
| Calls/min | Number of calls the application is receiving per minute. |
Browser Monitoring
The Browser Monitoring dashboard displays the following metrics for your applications.
| Field | Description |
|---|---|
| Name | Application name. |
| Apdex | Apdex score calculated based on the performance of the application. |
| Users impacted | Number of users impacted by errors. |
| Errors | Number of errors. |
| Load time(ms) | The load time taken by the application. |
| Calls/min | Number of calls to the application per minute. |
Mobile Monitoring
The Mobile Monitoring dashboard displays the following metrics for your applications.
| Field | Description |
|---|---|
| Name | Application name. |
| Alerts | Number of alerts the application receives. |
| Crashes | Number of crashes that occurred. |
| Error rate(%) | Percentage of error-free users. |
| Avg. HTTP response time | This KPI shows the average response time taken in seconds. |
VM Monitoring
The VM Monitoring dashboard displays the following metrics for your applications.
| Field | Description |
|---|---|
| Name | Host name or the custom name configured while installing the agent. |
| CPU usage(%) | Shows the % of CPU usage on the host. |
| RAM available(%) | Shows the RAM memory available on the host. |
| Storage available(%) | Total disk space available. |
| Network bandwidth usage(KB/s) | The network bandwidth usage. |
Standard Dashboard Beta
Following capability dashboards are available for you to comprehend at a glance when you select Standard Beta from the Select dashboard drop-down list.
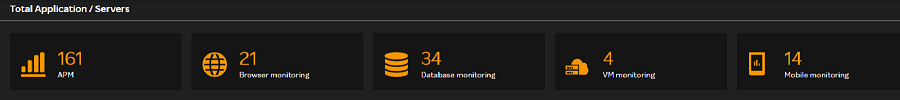
The Total Application/Servers window displays the total number of applications or servers.
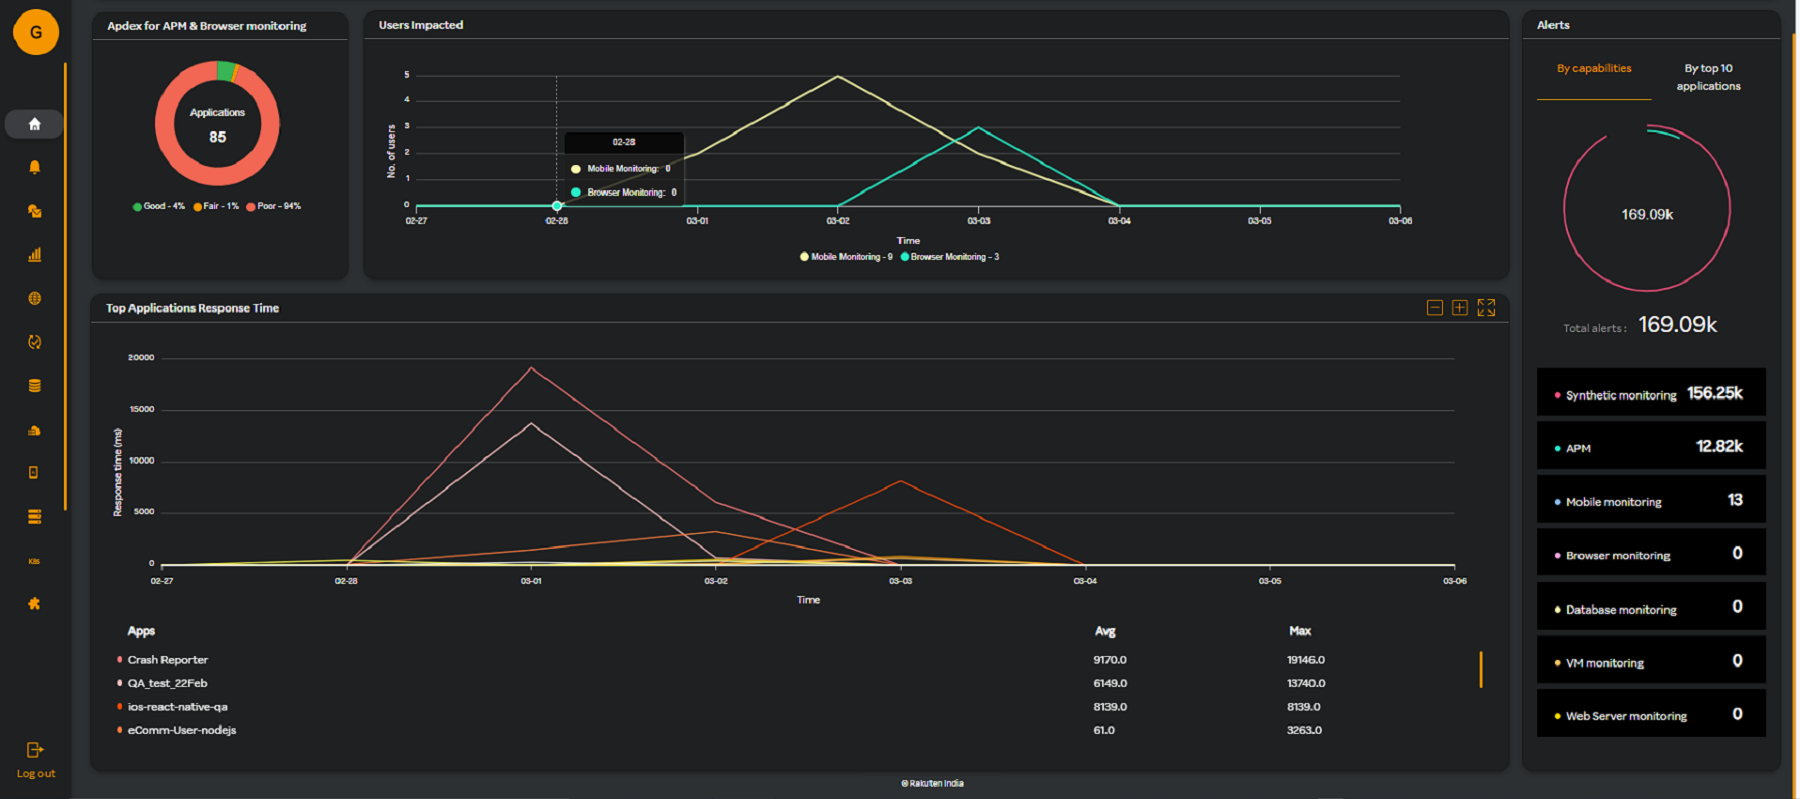
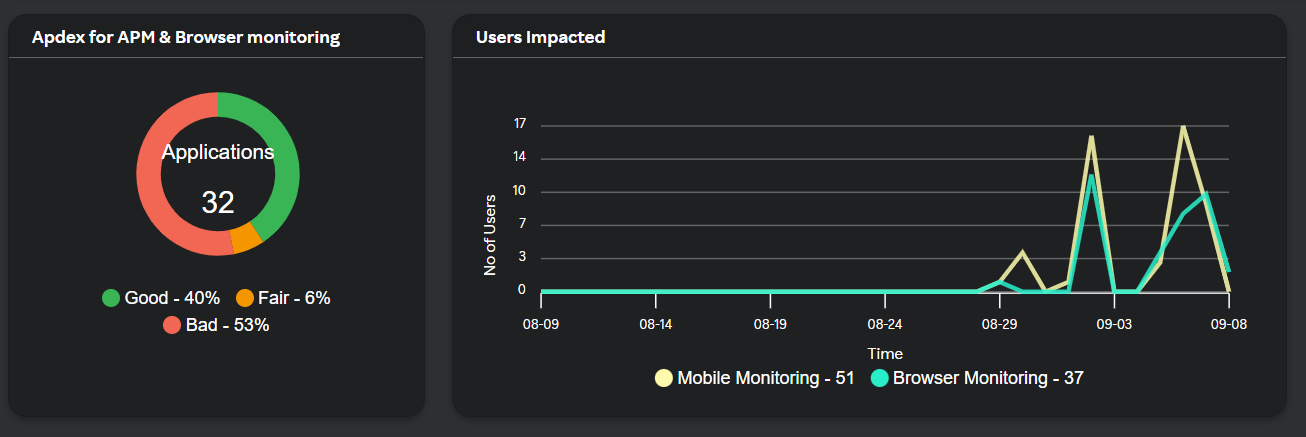
The Apdex for APM & Browser monitoring window displays the apdex score calculated based on the performance of the application.
The Users Impacted window displays the total number of users impacted for Mobile and Browser monitoring capabilities.
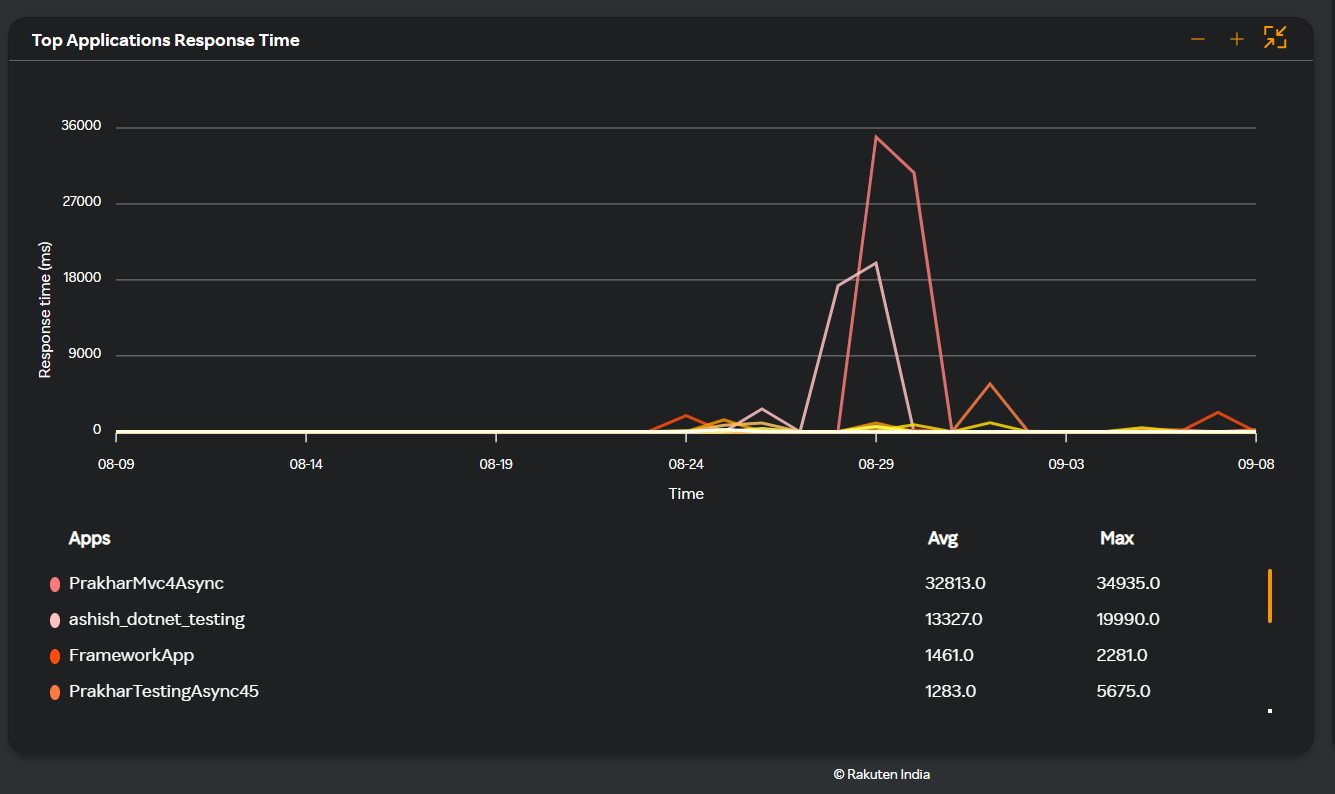
The Top Applications Response Time widget displays the top applications response time in milliseconds.
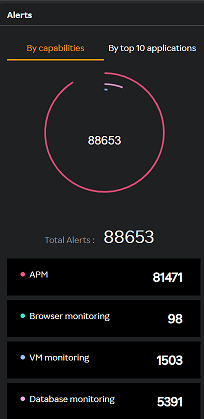
The Alerts window displays alerts by capabilities and top ten applications.
Customizing Dashboards
Role: SOE, SRE, L1, and L2 support
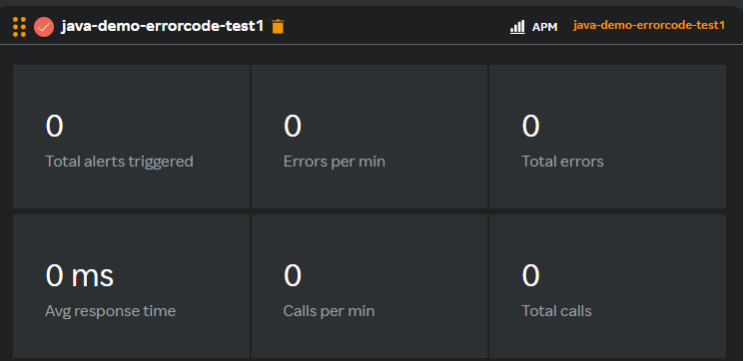
You can customize dashboards from the Home page once you login to the SixthSense portal using the Add dashboard tab. Customizing dashboards represents the summary of APM, BM, MM, and VM monitoring.
The summary widget represents the following summary of applications and VMs.
| APM, BM and MM Application Summary | VM Summary |
|---|---|
| Application name | Host name name |
| AVG Response time | CPU % |
| Calls per min. | Memory % |
| Total Calls | Disk Usage |
| Total Errors | Total Alerts triggered |
| Errors per min. | Active/Inactive |
| Total Alerts triggered |
Creating a dashboard and adding widgets
To create a dashboard and add a widget, perform the following procedure.
- Navigate to Home on the left pane from the SixthSense Observability portal page.
- Click Add dashboard. The Add dashboard screen appears as follows.
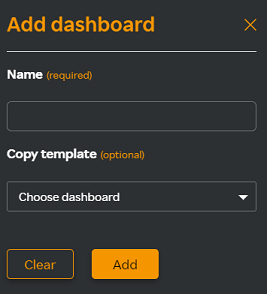
- In the Add dashboard window, enter the following details.
| Field | Description |
|---|---|
| Name | The dashboard name. For example LM. |
| Copy template | (Optional) The existing dashboards where the Application summary and VM summary options are already available. Once you select any of these from the drop-down, the following drop-down fields become available. |
| Select capability | This option is available if you have selected Application summary. APM, Browser monitoring, and Mobile monitoring capabilities are available. |
| Select application |
|
- Click Add. A new dashboard by name LM is created and you can now create custom dashboards by adding a widget.
note
Application, Browser, and Mobile Monitoring Summary
The application name will have a tick mark where the color of this will be as represented by Apdex score of the application. In the following screen, the tick mark is Amber which means the apdex score is poor. Yellow tick mark would mean fair and Green would mean that the apdex score is good. This tick mark will not be available for Mobile monitoring.
Clicking on the alert will take you to the Alerts page and clicking on the other metrics will take you to the specific applications.
VM Summary
- The host’s name will have a tick where the colour of this will be represented by the Active/In-active state of the application.
- Clicking on the alert will take you to the Alerts page and clicking on the other metrics will take you to the selected VM monitoring page.
Select a dashboard from the Select dashboard drop-down list to edit or delete a dashboard.
You can create a maximum of 30 summary widgets, and move them around to create a sequence of priority.
- Click the Add widget tab on the top right corner of the page. The Add widget screen appears as follows:
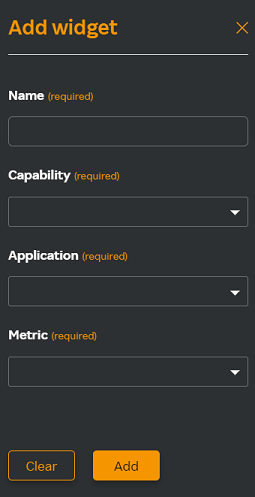
- Enter the following details.
| Field | Description |
|---|---|
| Name | Name for the widget. For example, LM1 and LM2. |
| Capability | Select a capability from the drop-down list. |
| Application | Select an application from the drop-down list. |
| Metric | Select a metric from the drop-down list. |
- Click Add. The widgets LM1 and LM2 are added under the LM dashboard you created earlier.
Log monitoring
The following log monitoring dashboard is available for you to comprehend at a glance when you select LM from the Select dashboard drop-down list.
The Log Monitoring dashboard displays a similar screen as follows.
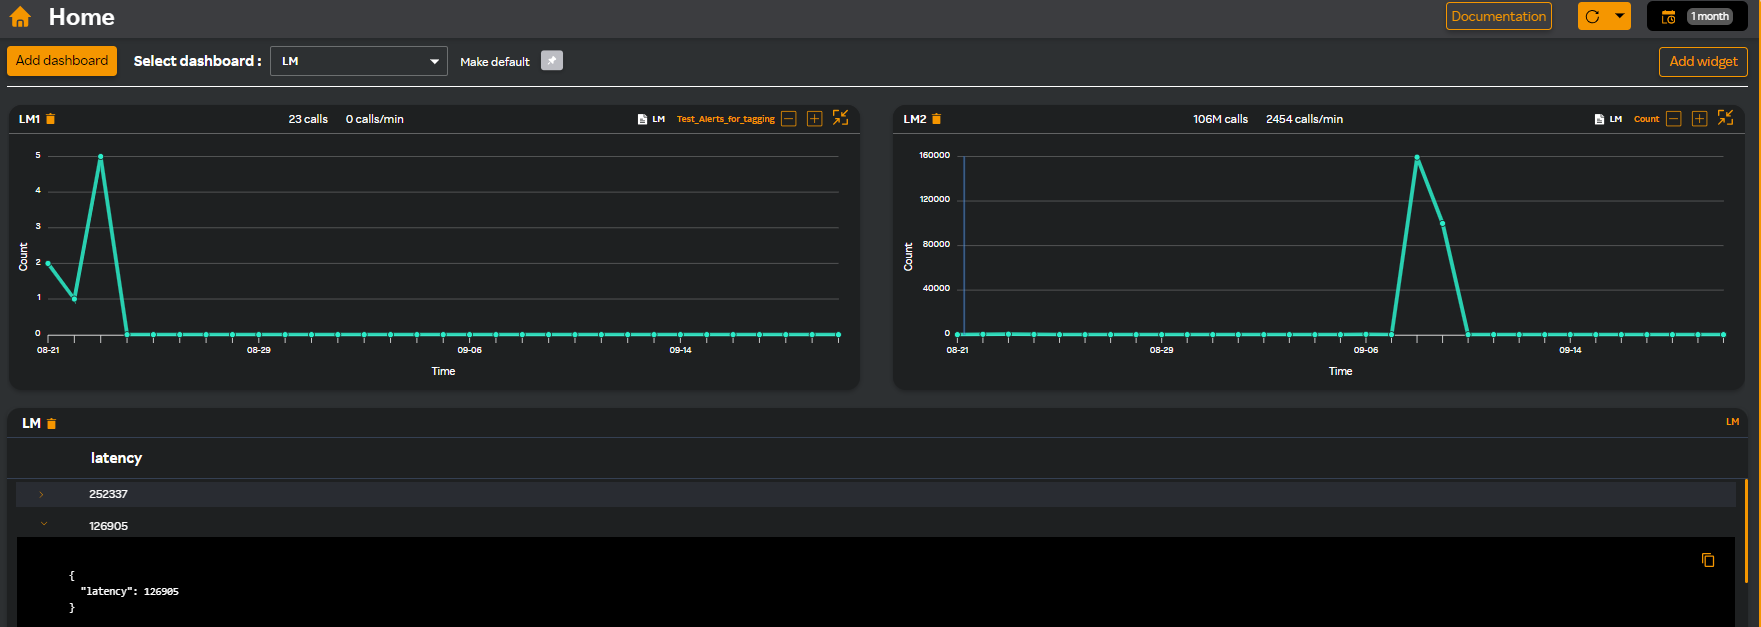
The dashboard contains graph widgets that you have created for various queries and a table below the graph widgets for queries that return non integers.