Overview
A log is a pillar because it records all events and errors that occur during a software resource's lifecycle. It is easy to see when a problem has occurred, or which events or trends correlate with it, by looking at logs. Logs provide information about events before and after the problem, which is used to determine the cause of the problem.
In a system, a log is a description of an event that occurred. The term log refers to a timestamped record of an event that is created by an application, VM, Cloud Intra, OS, or any other device. Data logged into log files will be in plain text.
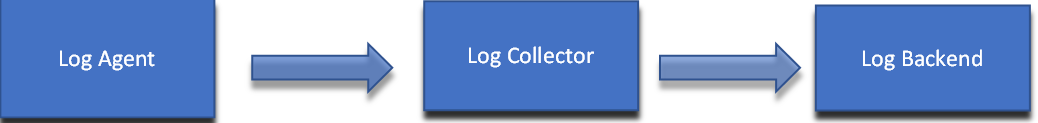
Log Monitoring Process
Logs are shipped using an agent to the backend collector, where it is processed and make it visualizable. Following is a simple log monitoring flow.
SixthSense Log Monitoring offers the following:
- SixthSense uses opensource agents like Fluentd and Logstash to send log data to our collector.
- Fluentd allows only sending logs that match the regex or key word. This reduces the amount of data sent and thereby reducing billing cost.
- Provides writing SQL queries on log data the same way as SQL. This allows better correlation and aggregation as auto-suggestions are provided.
- SixthSense makes it possible for users to configure custom grok configurations to extract fields from the logs to query and correlate them.
For more information about installing log monitoring agents, go to the Installing Fluentd section in the left pane, and for information about using the dashboard, see Log Monitoring Dashboard.