APM Trace
The Trace screen in the APM dashboard displays details of the error that occurred on an endpoint and the route it took to hop to the endpoint on an instance.
The SixthSense application supports two types of traces:
Success trace: This section displays all the endpoints that were successfully executed.
Error trace: This section displays the path adopted by the endpoint that resulted in an error.
The Trace screen provides the following options. Note that you can use the filter options to sort the data.
Trace window
Go to the Trace tab to analyze the transactions that were successful but were slow. You can sort the response time details by Start time or Duration by clicking on the Sort by: drop-down list.
Instances
The All Instances drop-down list displays the following options:
- All instances: Shows all the instances on which the application is installed.
- Particular instance: Click an instance displayed or search for an instance in the Search instances field to view details of a selected instance.
Error
The All status drop-down list displays the following options:
- All status: Shows all the errors with different statuses.
- Success: Provides further analytics on the successful transaction on that endpoint.
- Error: Shows all the errors occurring on a selected instance.
Endpoints
The All Endpoints drop-down list displays the following options:
- All endpoints: All the endpoints of the application are displayed.
- Particular endpoint: Select an endpoint or search for an endpoint in the Search endpoints field to view details of a particular endpoint. The following screen is displayed.

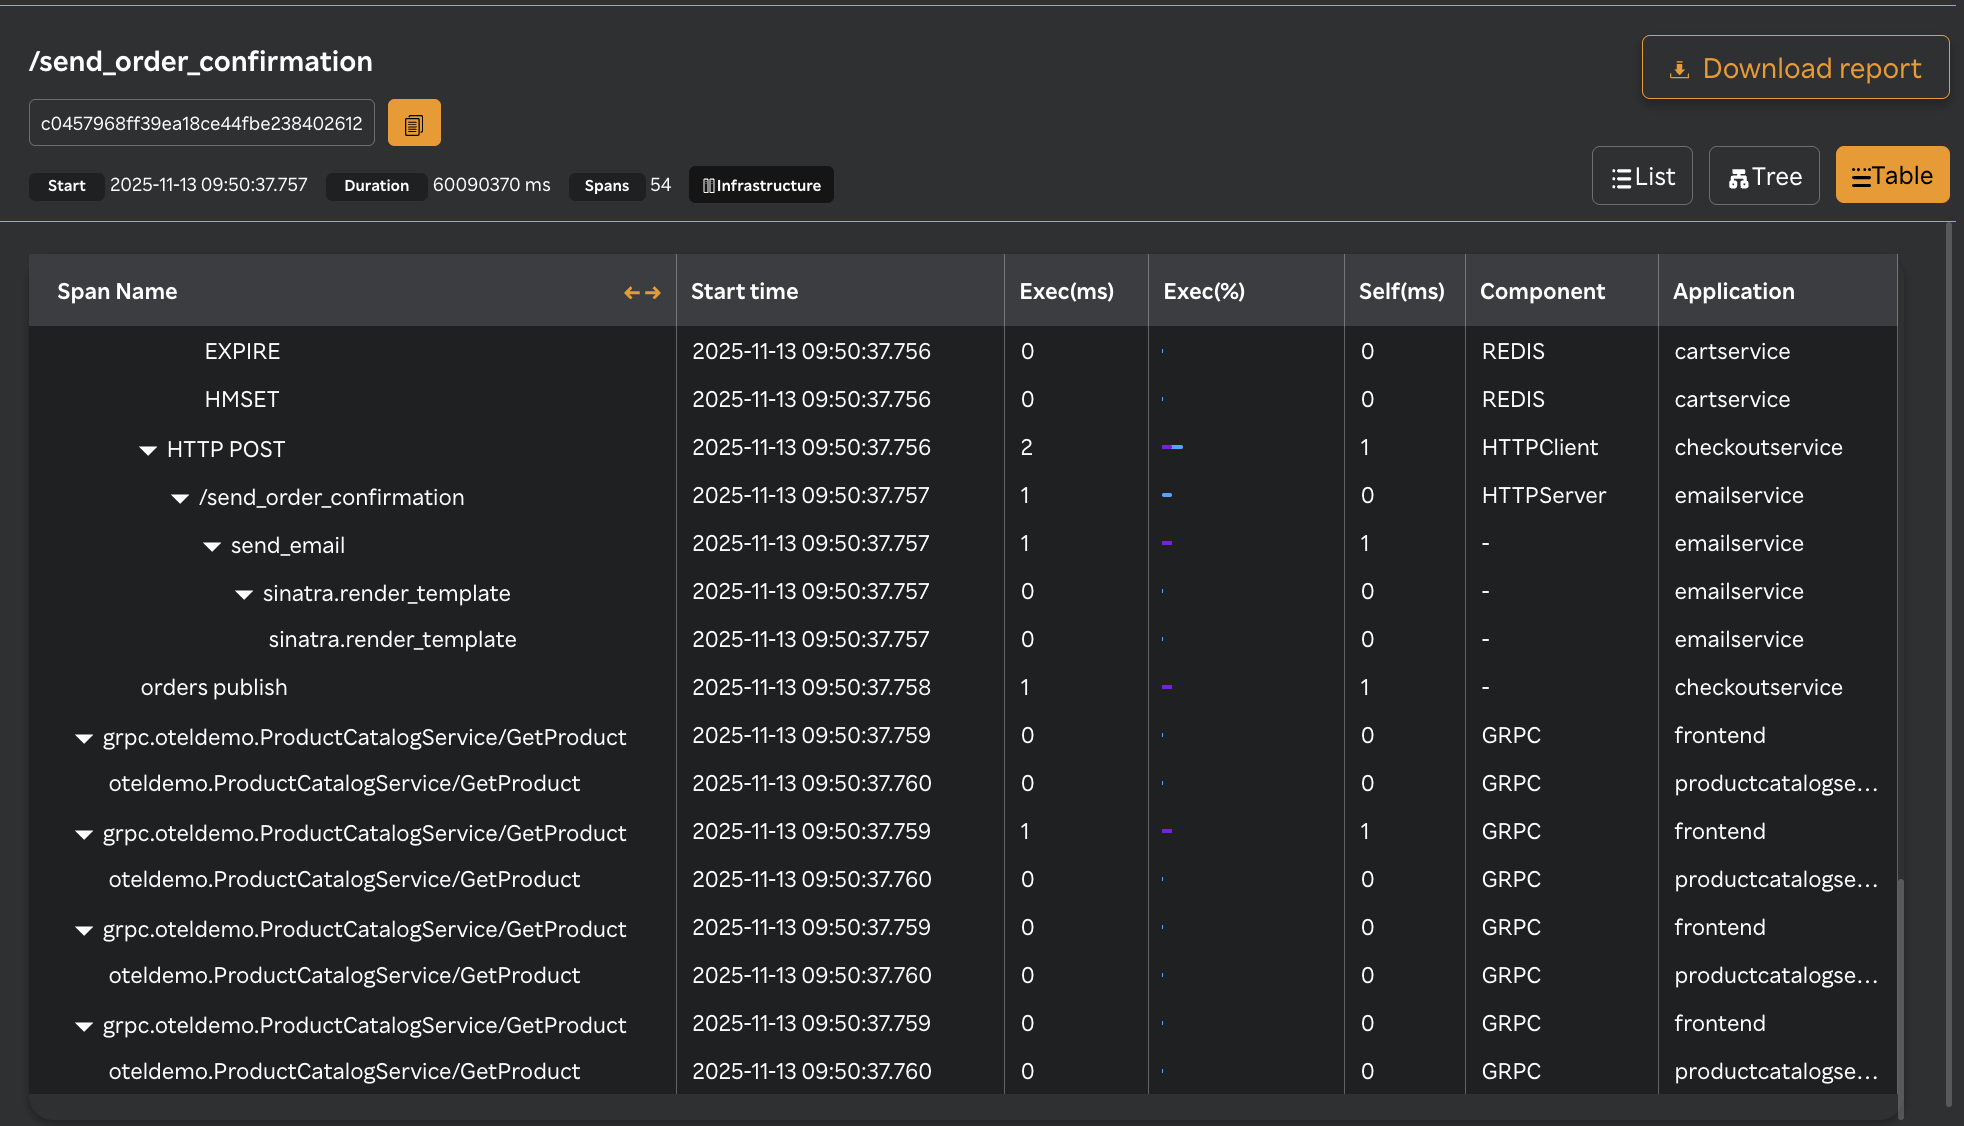
The Span Name column displays spans that are executing as displayed in the following screen. They are based on method-level profiling which helps identify and improve performance of an application. For example, identify methods that are taking a long time to execute.
note
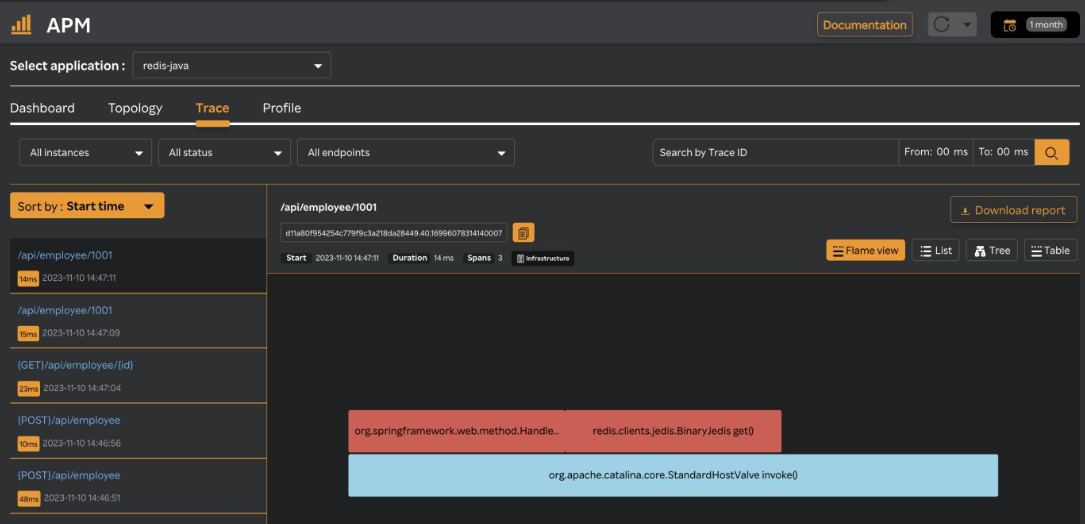
You can view the endpoint details in a list, tree, table or flame view format by clicking on the respective icons in the Trace screen.
The following screen is an example of a flame view.
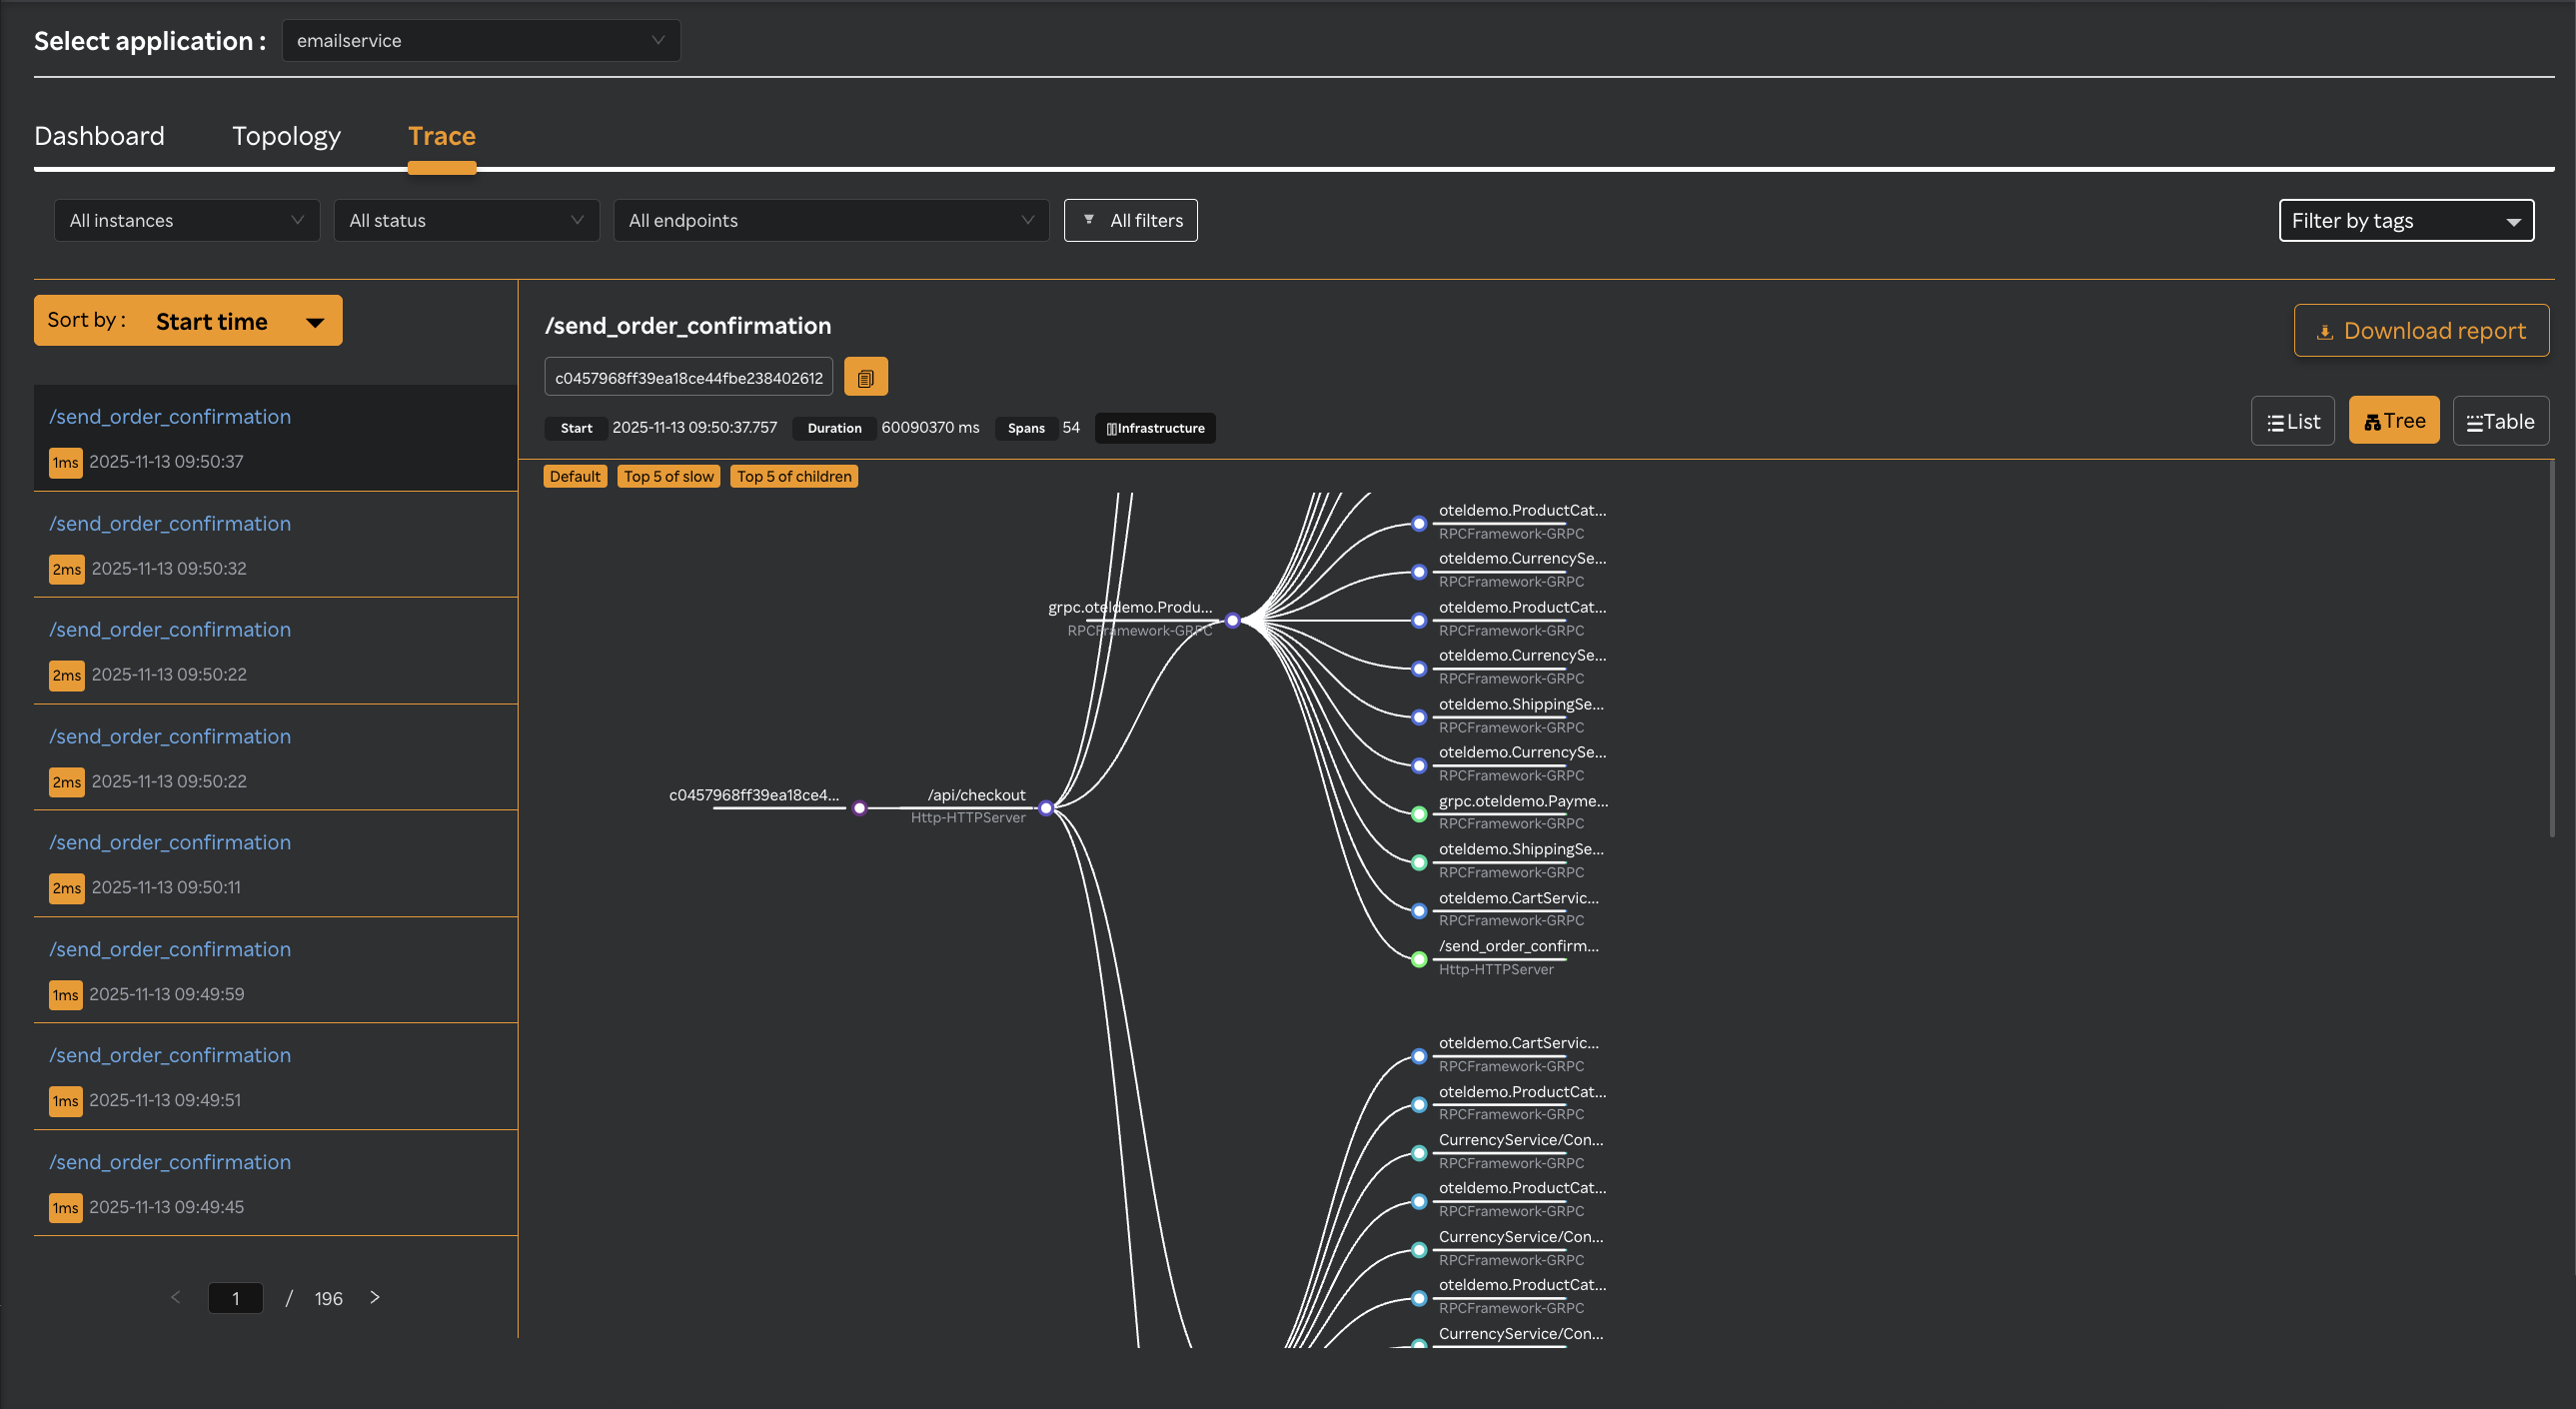
The following screen is an example of a Tree view.
Infrastructure Correlation
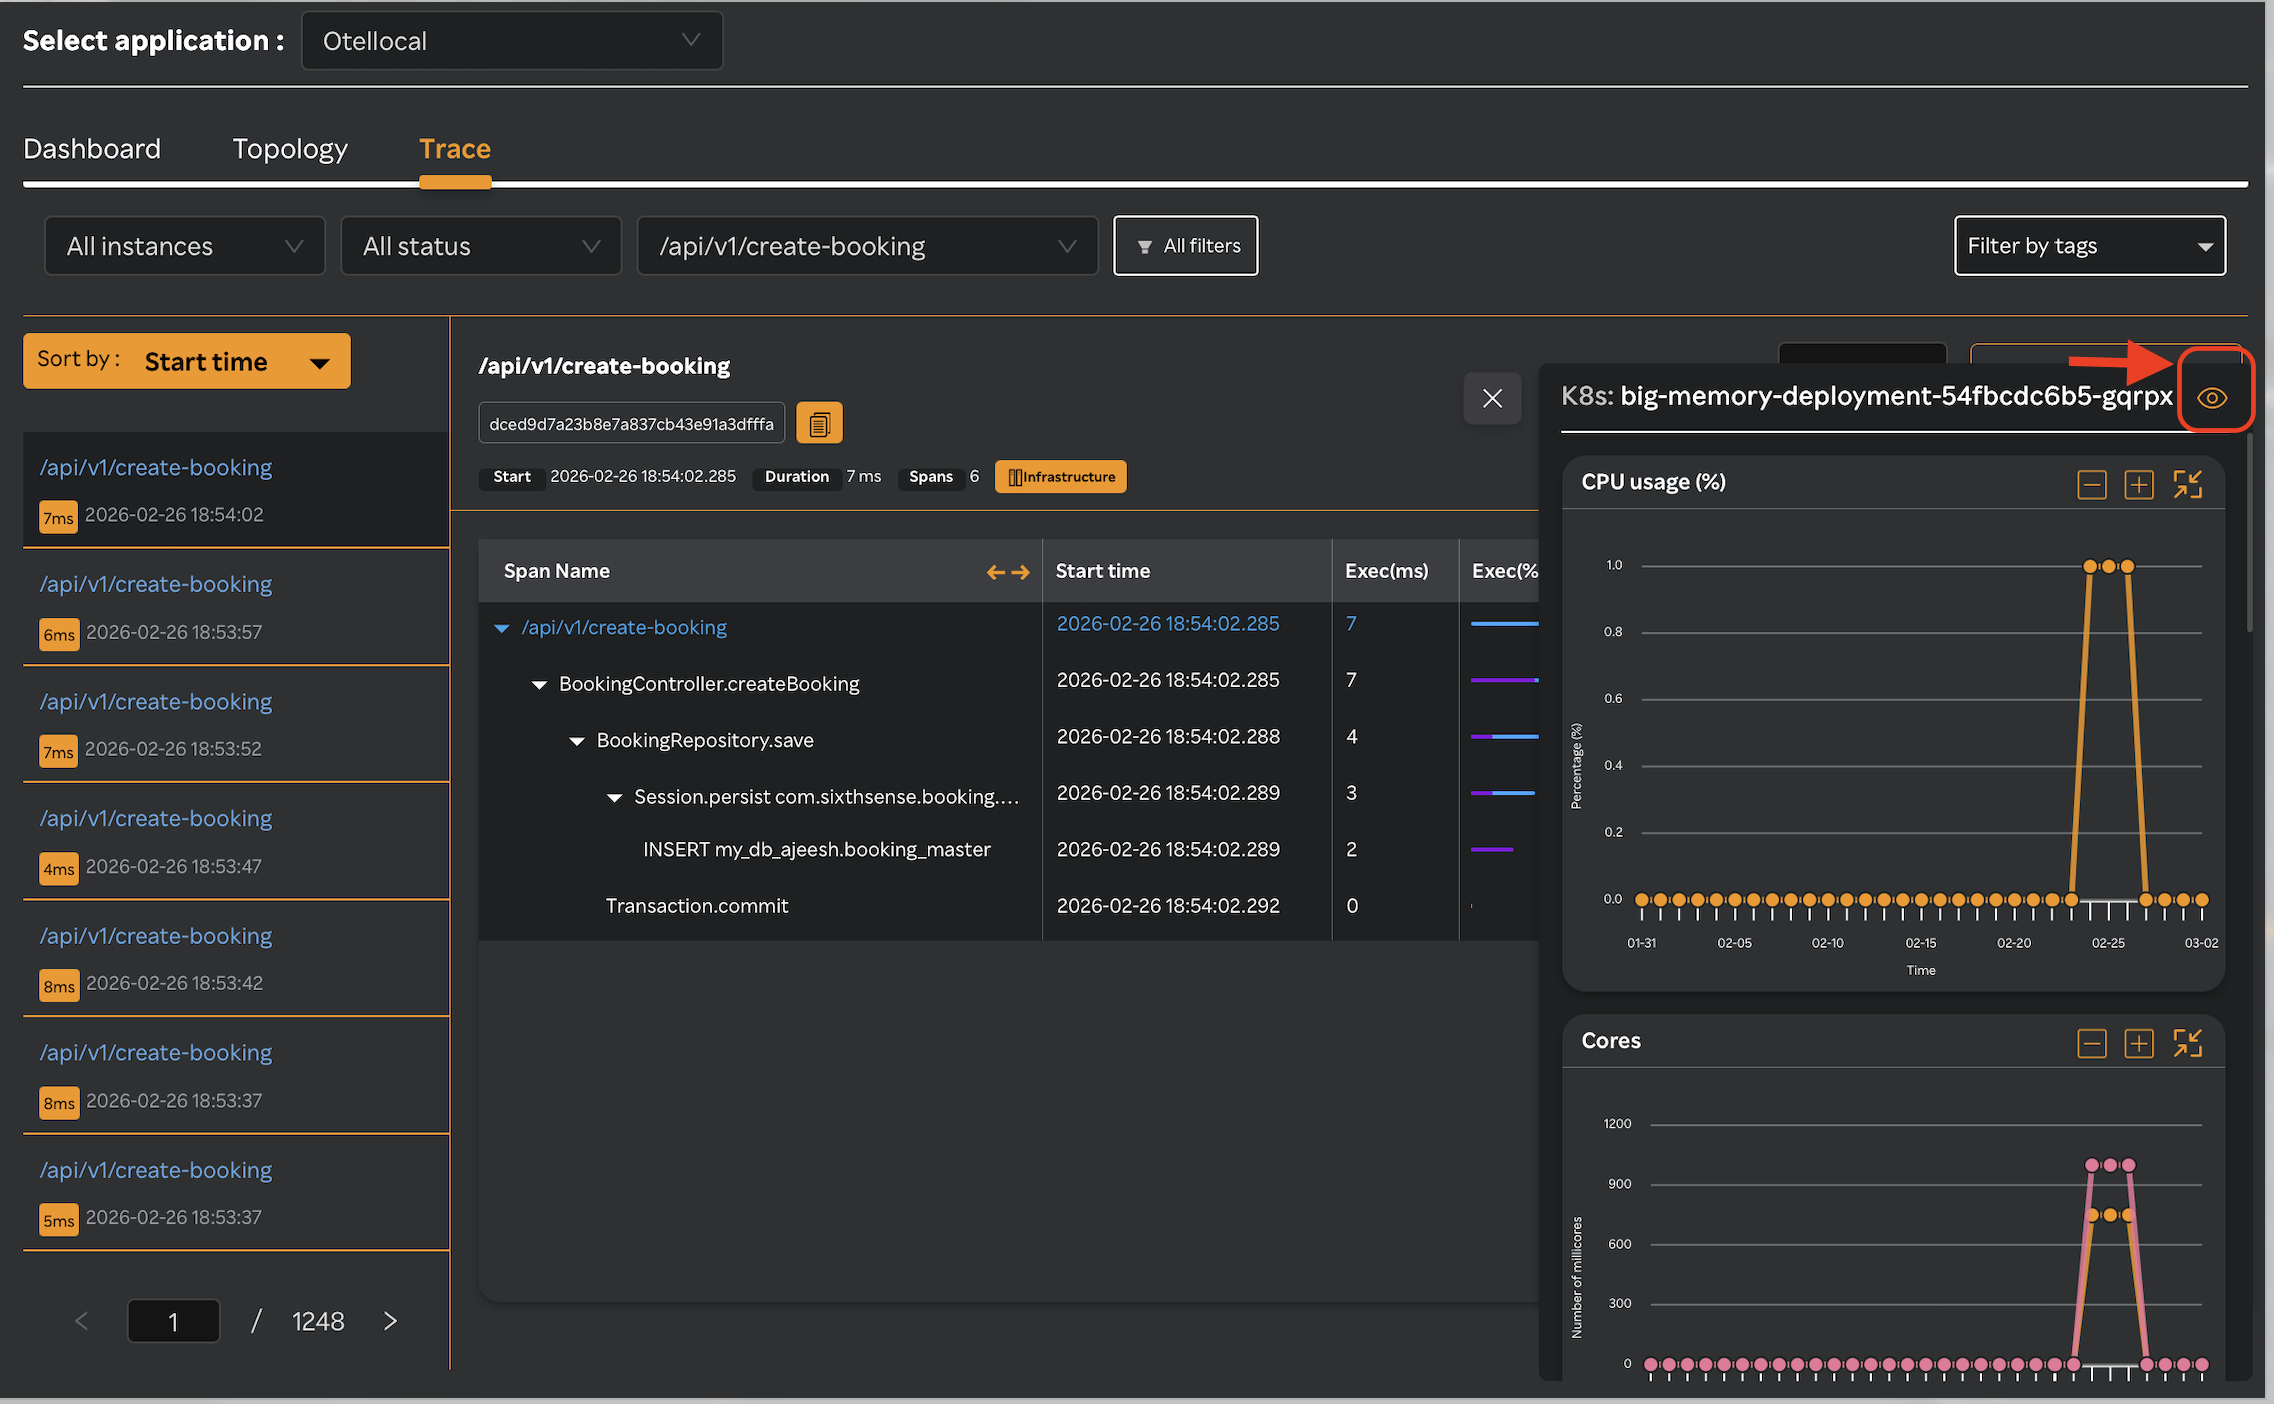
When the SixthSense Kubernetes Agent is installed on the infrastructure along with the APM Agent, the Infrastructure Correlation feature becomes available to visualise kubernetes infrastructure utilization metrics directly within the APM view to correlate application performance data with underlying Kubernetes infrastructure metrics.
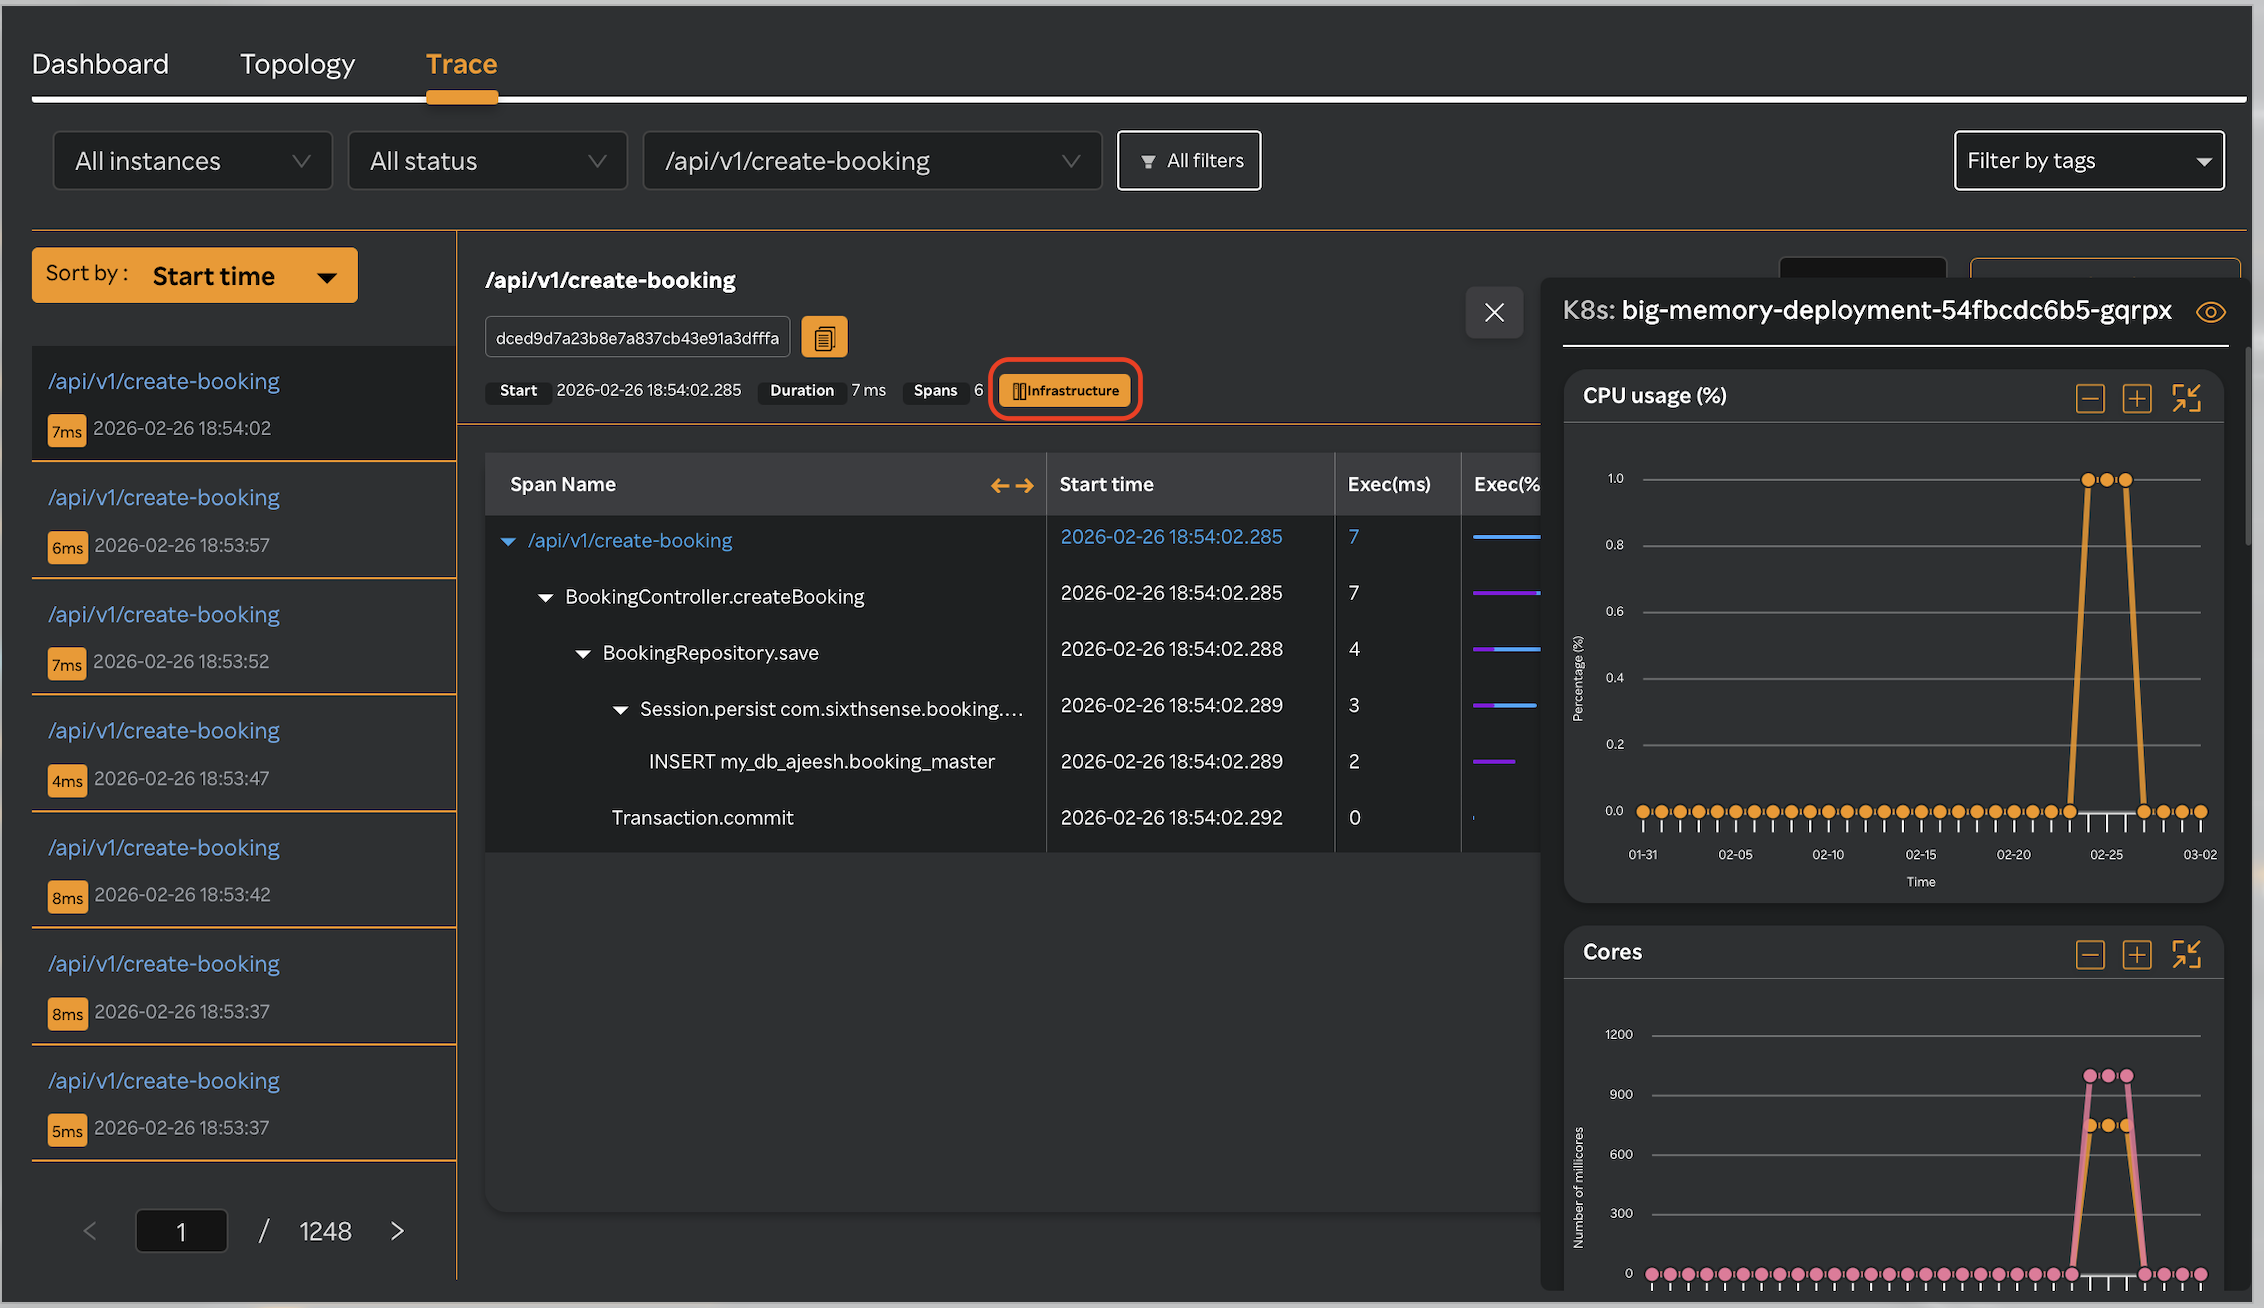
Click on 👁️ symbol to visualise more infra metrics on Infrastructure tab
Downloading the trace report
Selecting the Trace tab and clicking  will download the trace details along with the application name in a PDF format.
Navigating to Trace, selecting Error from the All status drop-down list, and clicking the will download the Error Trace details and VM details along with the application name in PDF format.
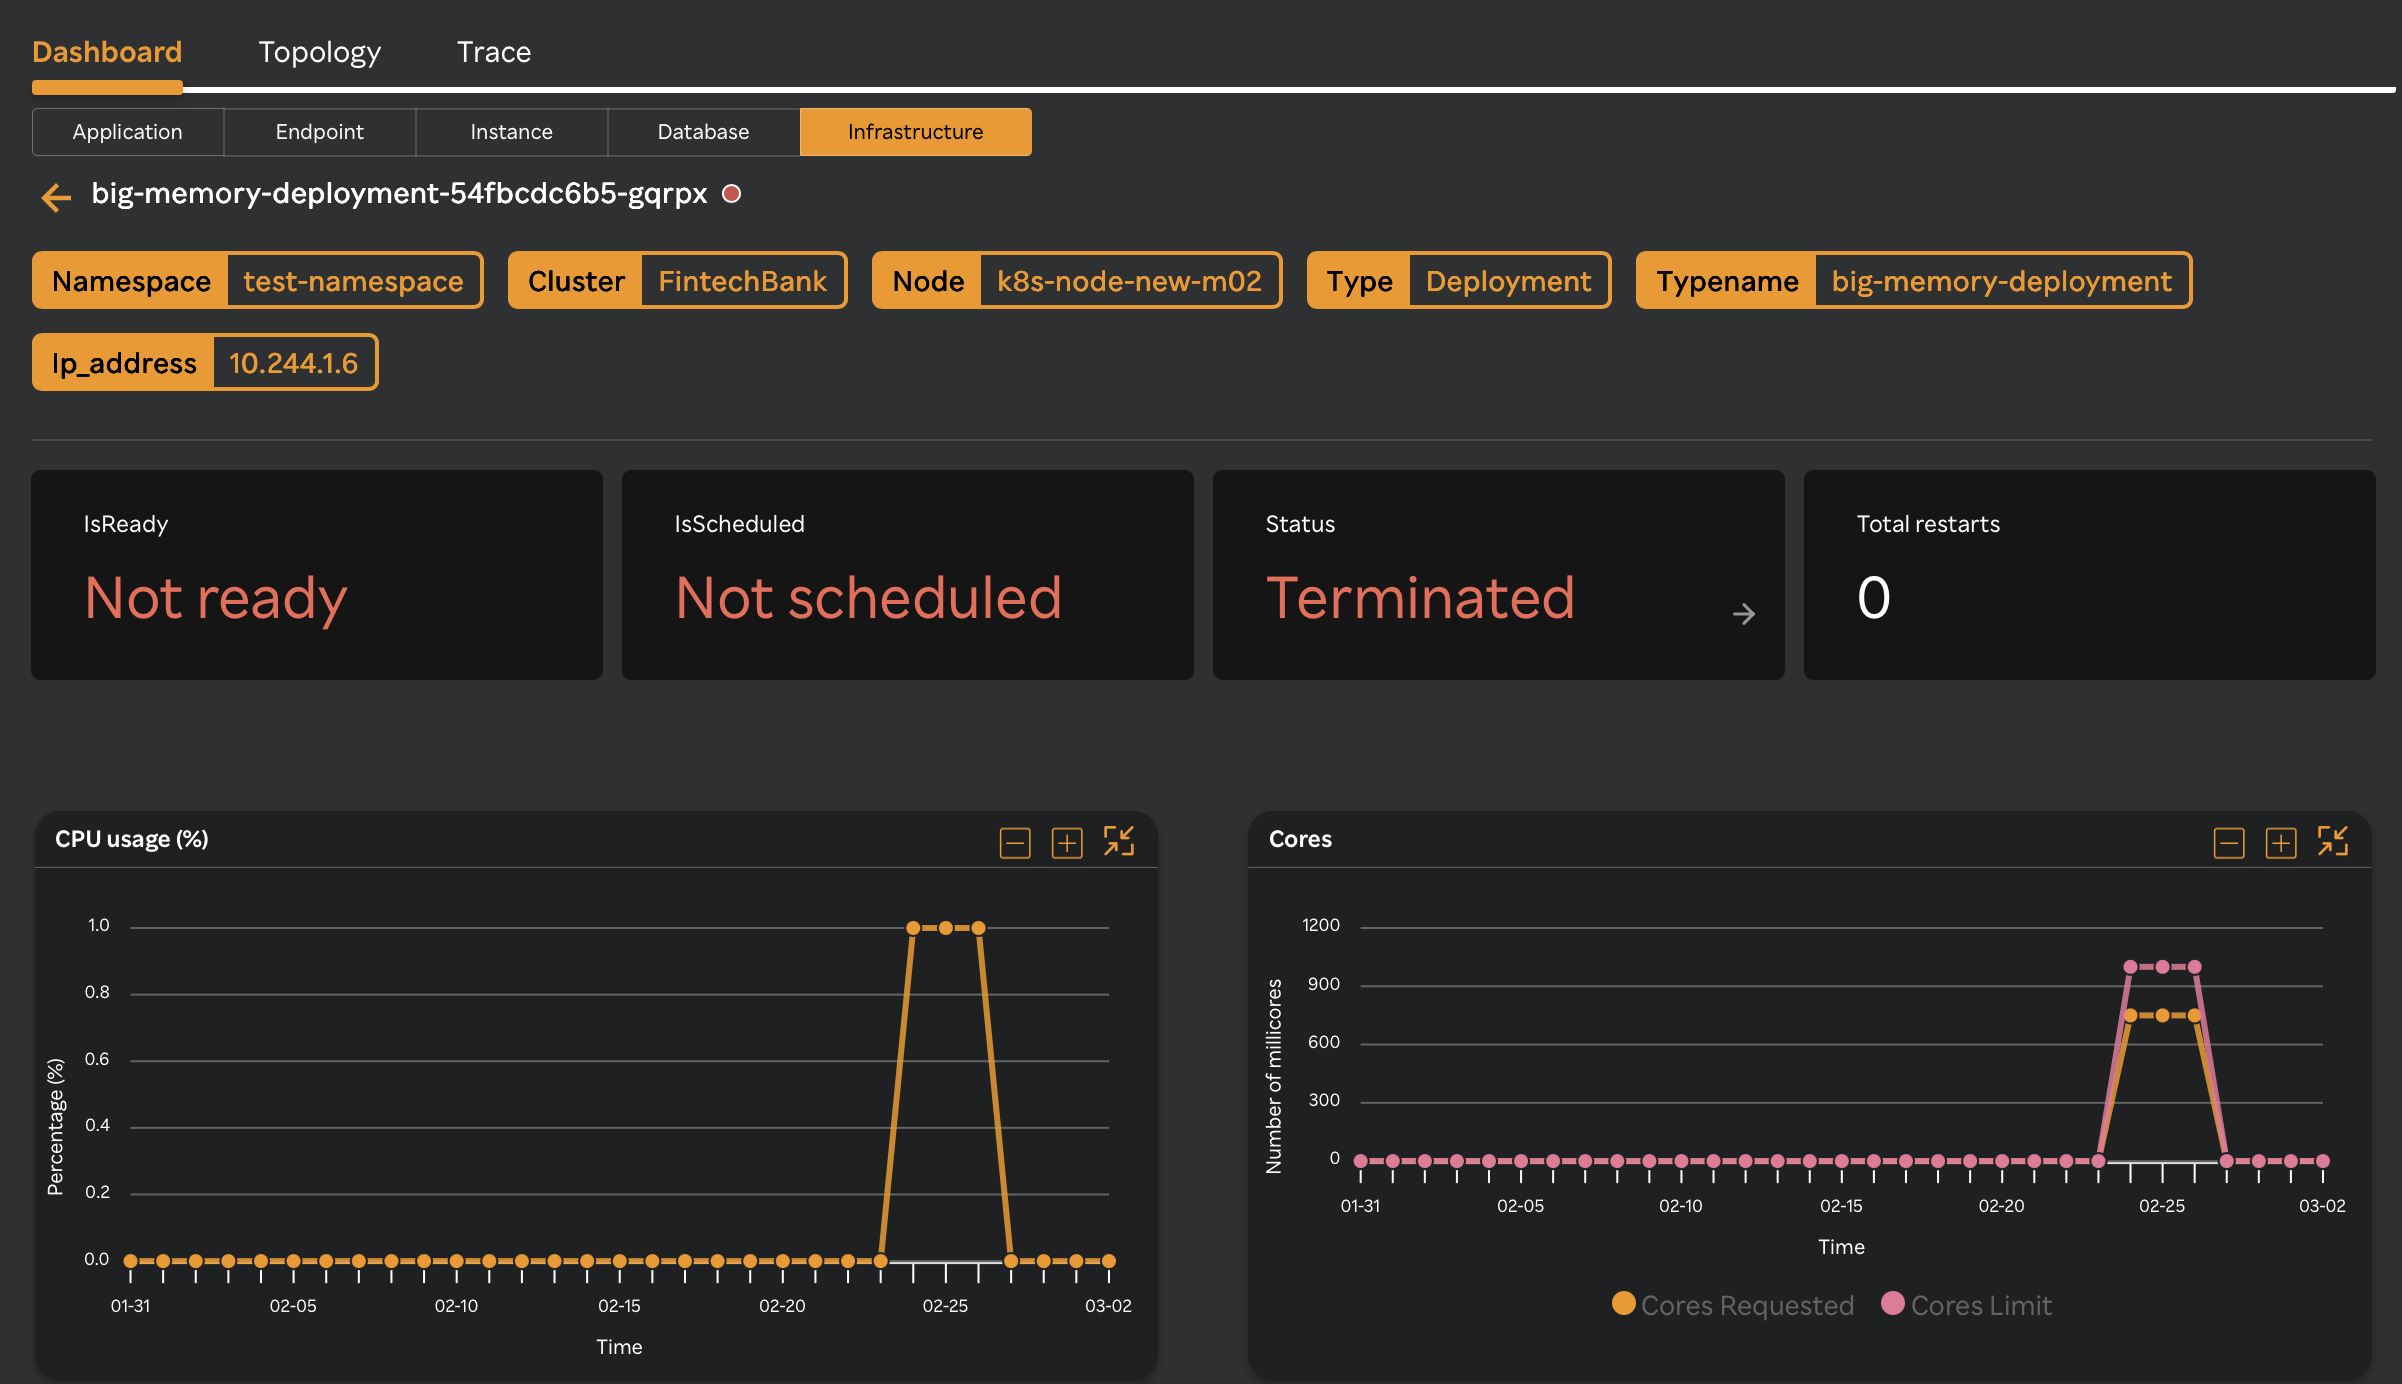
Click the Infrastructure ![]() icon to view the correlated VM details. For more information, see Infrastructure.
icon to view the correlated VM details. For more information, see Infrastructure.
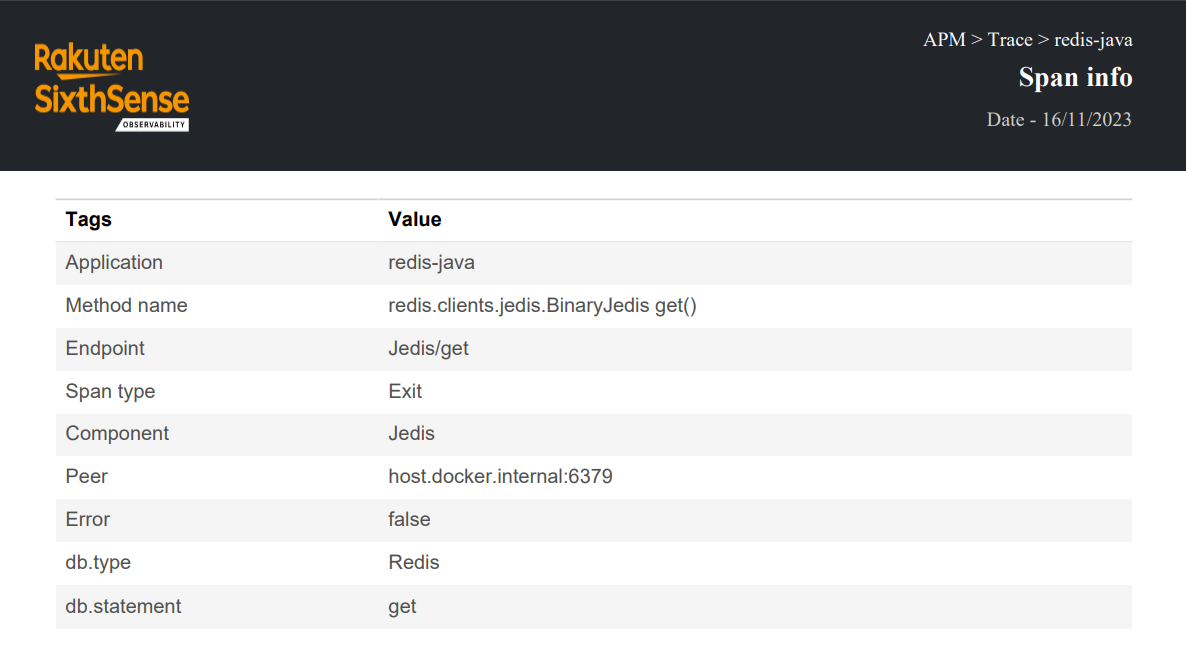
Click an endpoint under the Span or Span name column, to view the Span info window with the following details.
| Tags | Value |
|---|---|
| Application: | Application name |
| Endpoint: | Endpoint that is causing the error. |
| Span type: | Information about a specific code path that has been executed. |
| Component: | Specific module in the software code. |
| Peer: | Details of a peer-to-peer event. |
| Error: | Specifies the error type. |
| URL: | Exact URL of the endpoint. |
| http.method: | API method type. |
| http.status.code: | Code that identifies the status of an error. |
| http.status.msg: | Message status. |
Downloading the Span info report
Clicking the will download the span information report in a PDF format as in the following screen.
Logs
| Field | Description |
|---|---|
| Time | Time stamp of the endpoint error. |
| Event | Type of event. |
| Error.kind | Details of the endpoint error. |
| Message | Detailed description of the endpoint error. |
| Stack | Navigate to the exact line of code. |
Error traces
The Error traces screen displays the errors on the left pane which can be sorted by Start time or Duration of the errors. The endpoint error details with the method name, execution time, application name and so on are displayed on the right side for you to analyze the root cause.
Slow traces
The Slow traces screen displays all the endpoints that were slow against the expected load time. Using slow traces details, you can identify the endpoints that caused the slowness. And you can further analyze the root cause for the slowness using method name and execution time.
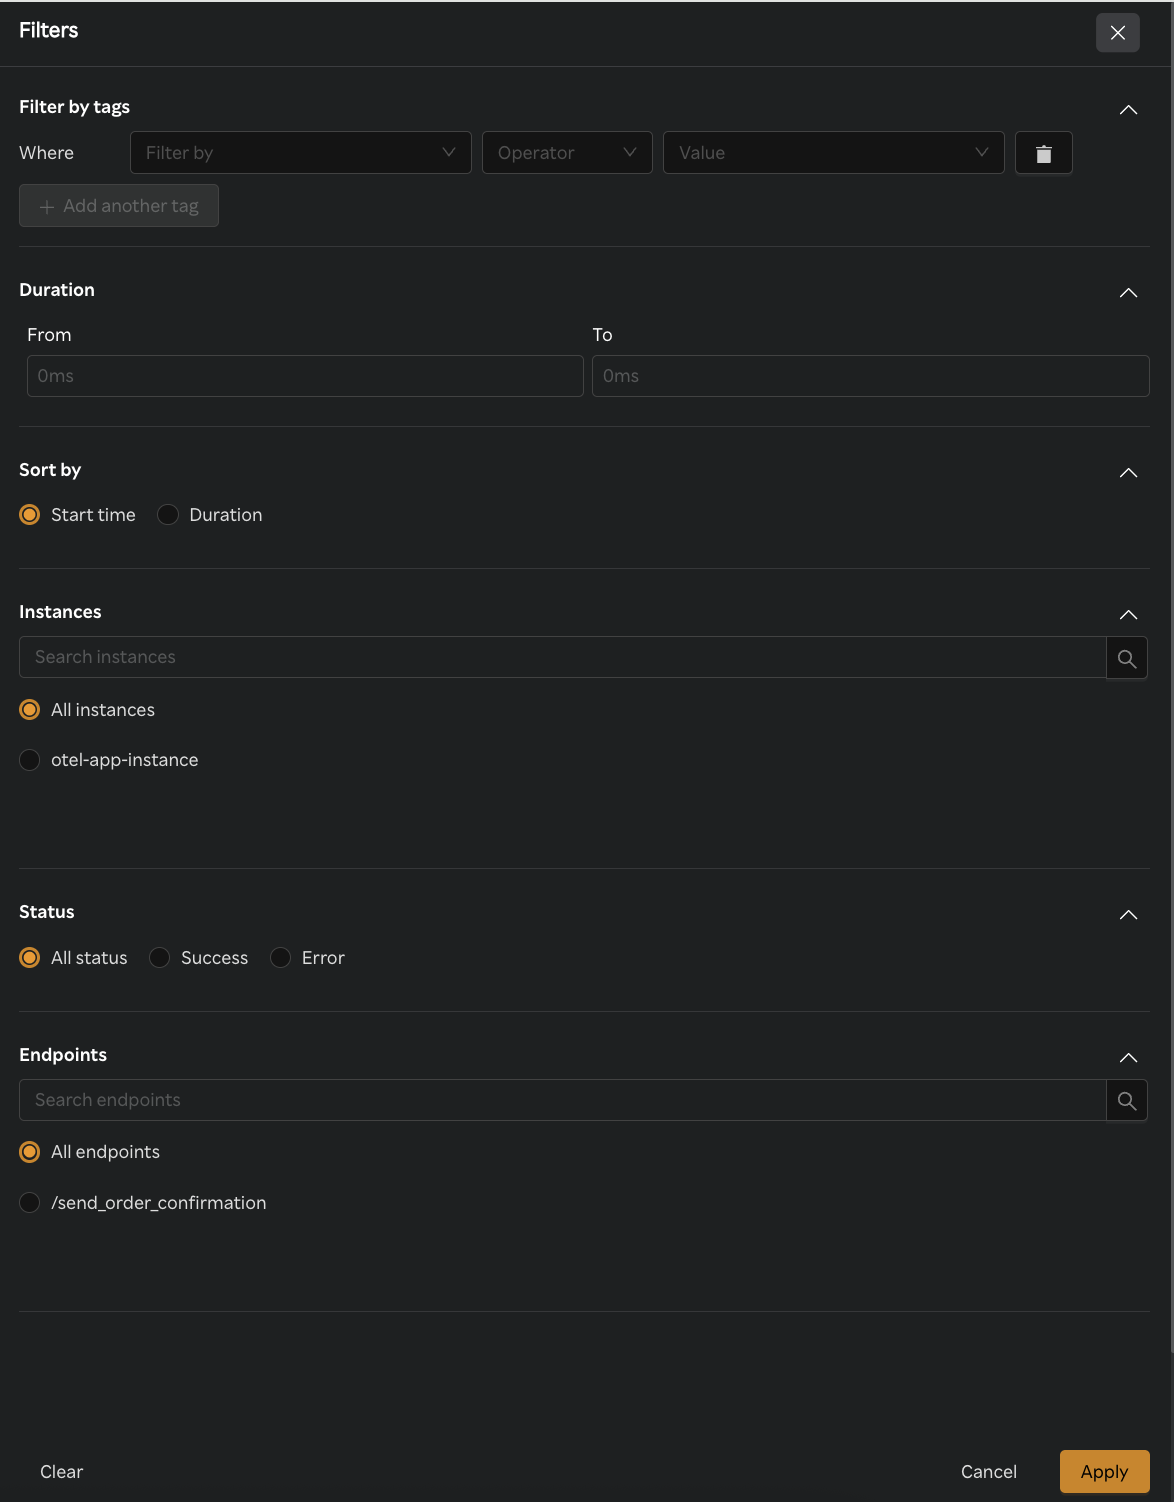
Tags Filter
- You can "filter by tags" to apply a single filter immediately from right top corner.
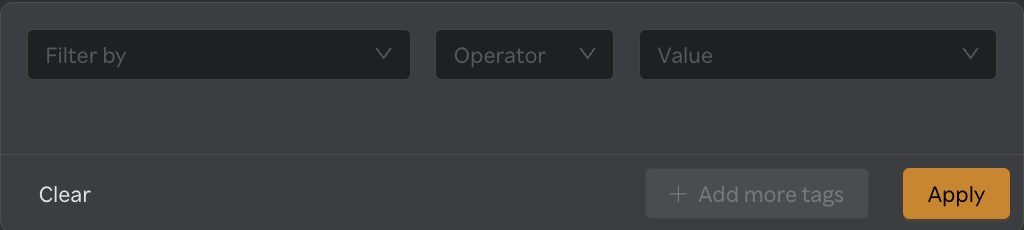
| Field | Description |
|---|---|
| Filter by | Displays all the span info keys when dropdown is clicked. |
| Operator | "=" Displays traces matched exactly the value entered,"LIKE" Displays traces matched with the keyword entered,"!=" Displays traces which does NOT match exactly with the value entered. |
| Value | Value of the filter selected. Enter the input as per the filter selected. |
- Click on "All filters" to apply either multiple tag based filters along with other filters.
- 'AND' logic is applied among multiple filters when applied.
- When any filter is applied, traces which matches these filters will be visualised on the screen.