Enabling code profiler from Settings
Role: Standard Operation Environment (SOE), Site Reliability Engineers (SREs), and Developers.
Enabling code profiler for Java provides insights into the resource utilization of each method or functions within a developer's code such as CPU time, Memory usage and so on. This information helps developers optimize resource allocation and identify memory leaks or excessive resource consumption. The code profiler option can be enabled from the Settings page available in the SixthSense portal using the following procedure. You can also enable the code profiler from the APM capability page. For more information, see APM Code Profiler.
note
Code profiler is only available for Java APM version 1.20.0.
- Navigate to Settings available on the left pane in the SixthSense portal.
- Click the Application tab.
- Click Code profile.
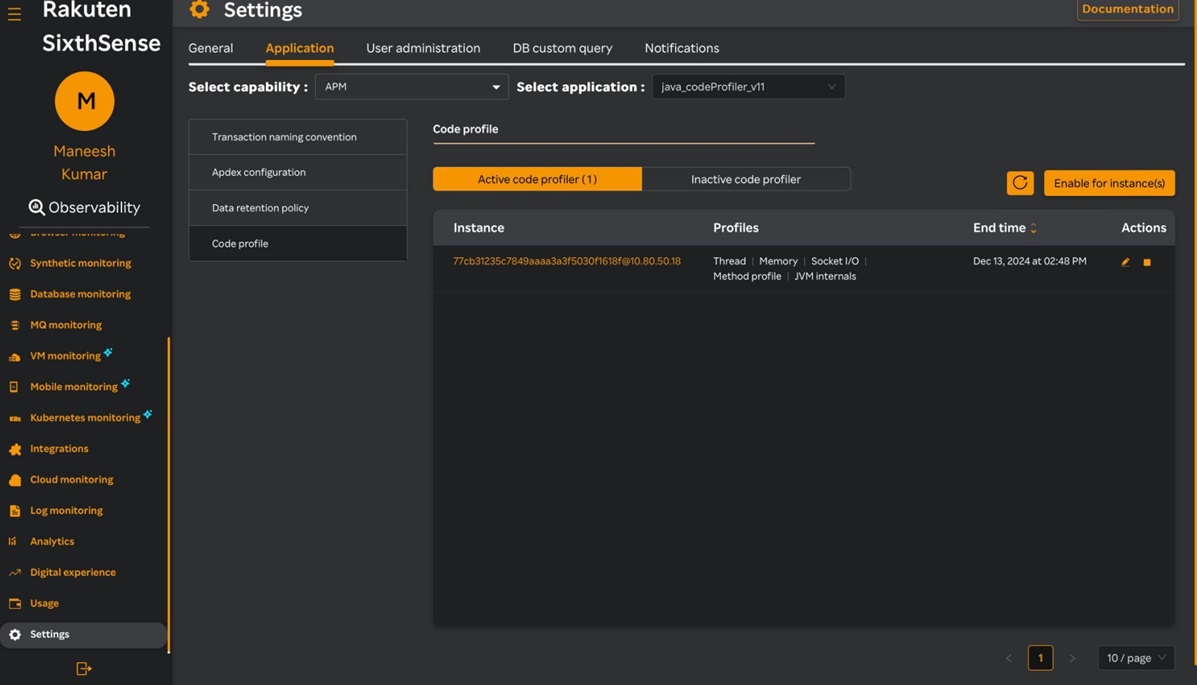
The Code profile page appears similar to the following screen.

This page contains the following fields.
| Component | Description |
|---|---|
| Active code profiler | This tab is selected by default and displays the number of active code profilers. |
| Inactive code profiler | This tab displays the number of inactive code profilers. |
| Instance | This column lists instances along with their profiles and end time. Note that clicking on an instance will redirect you to the APM > Dashboard > Instance > Threads page. |
| Actions | This column displays the |
If there are no active code profilers, enable them from this page by using the following procedure.
- Select the capability from the Select capability drop-down list.
note
Only APM and Browser monitoring capabilities are available currently.
- Select an application from the Select application drop-down list.
- Click Enable for instances.
note
You can enable a maximum of up to 10 instances.
- Select Enable from the Disable drop-down list.
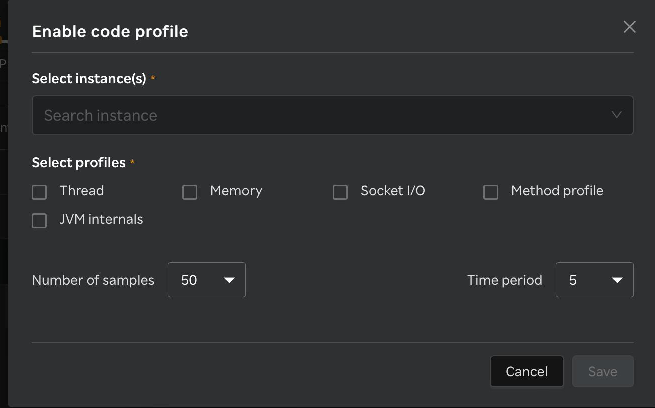
The following Enable code profile screen appears.

- Select any of the active instances from the Select instance(s) drop-down list.
- Select the profilers you want to enable.
- Select the number of samples from the No. of samples drop-down list.
- Select the time period in minutes from the Time period drop-down list.
- Click Save.
note
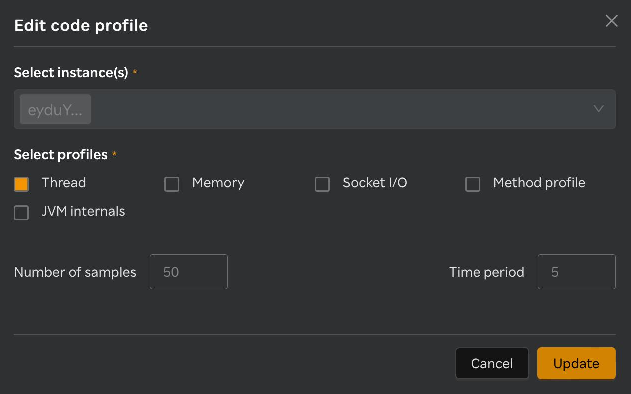
Number of samples and time period will be enabled only while enabling the profiler and will be disabled while editing the profiler.
You can also enable code profiles from APM. For more information, see Enabling code profiler from APM.
Editing a code profiler
- Navigate to Settings available on the left pane in the SixthSense portal.
- Click the Application tab.
- Click Code profile.
- Click the
icon under the Actions column against the instance you want to edit.
note
You can edit only the active code profilers.
A screen similar to the following appears.

- Modify the fields you want to edit in the Edit code profile screen.
- Click Update.
The code profiler is updated with your changes for the selected instance.
Stopping a code profiler
- Navigate to Settings available on the left pane in the SixthSense portal.
- Click the Application tab.
- Click Code profile.
- Click the
 icon under the Actions column against the instance you want to stop.
note
You can stop only the active code profilers.
A screen similar to the following appears.

- Click Stop.
The code profiler is disabled for the selected instance.