Browser Monitoring Dashboard
Browser monitoring capability monitors browser applications for performance while it is being used by a real user.
Performance monitoring metrics are obtained by the agents along with errors that the user encounters while browsing through a website. Browsing error correlation with APM helps the user not to spend more time on detection of the cause and helps in getting closer to the root cause faster.
Application
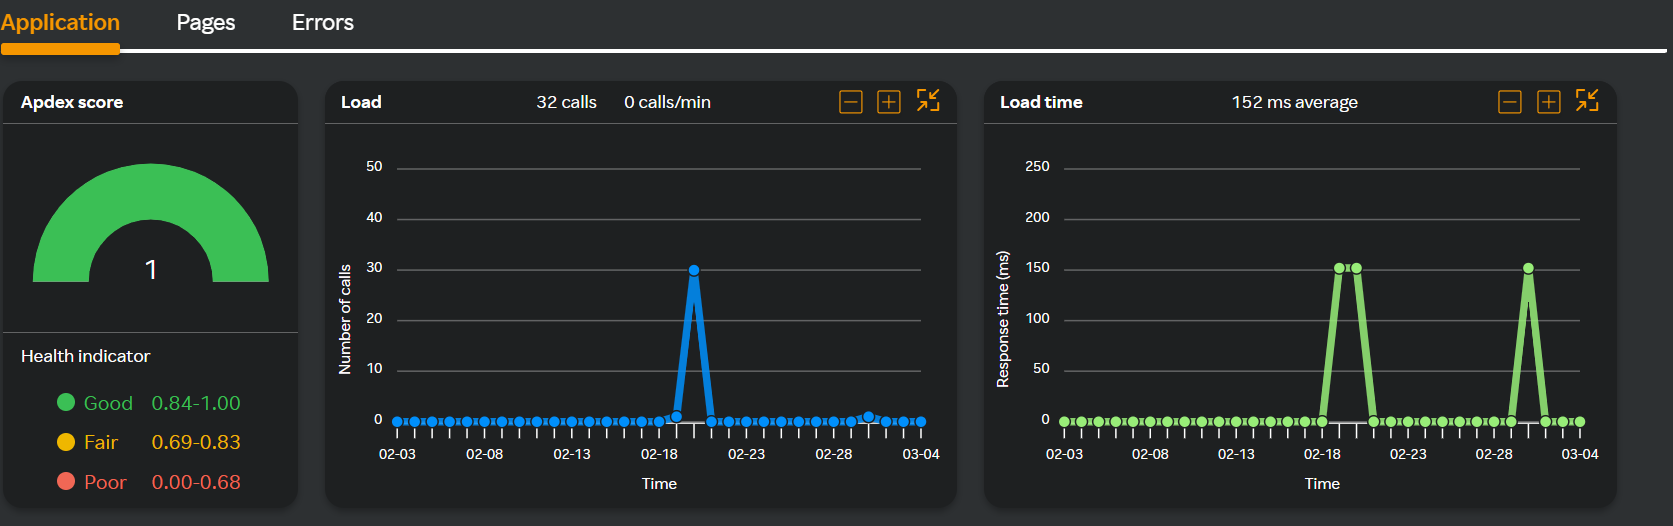
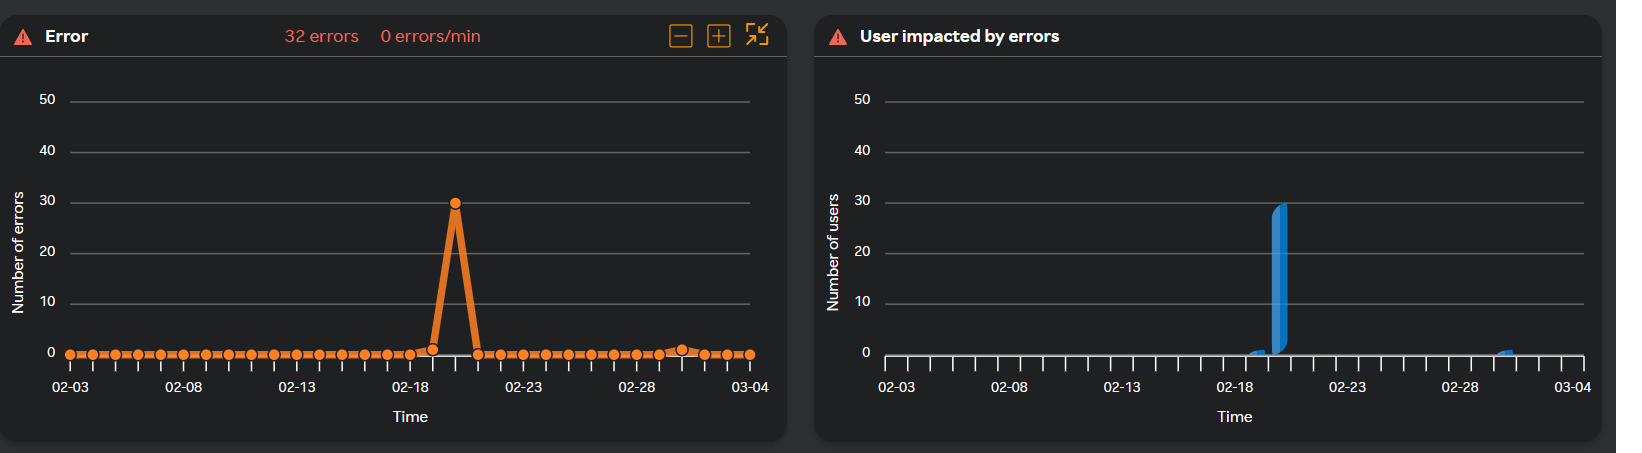
For a selected application the landing dashboard displays the following widgets.
- Apdex score
- Load
- Load time
- Error
- User impacted by errors
- Error count map
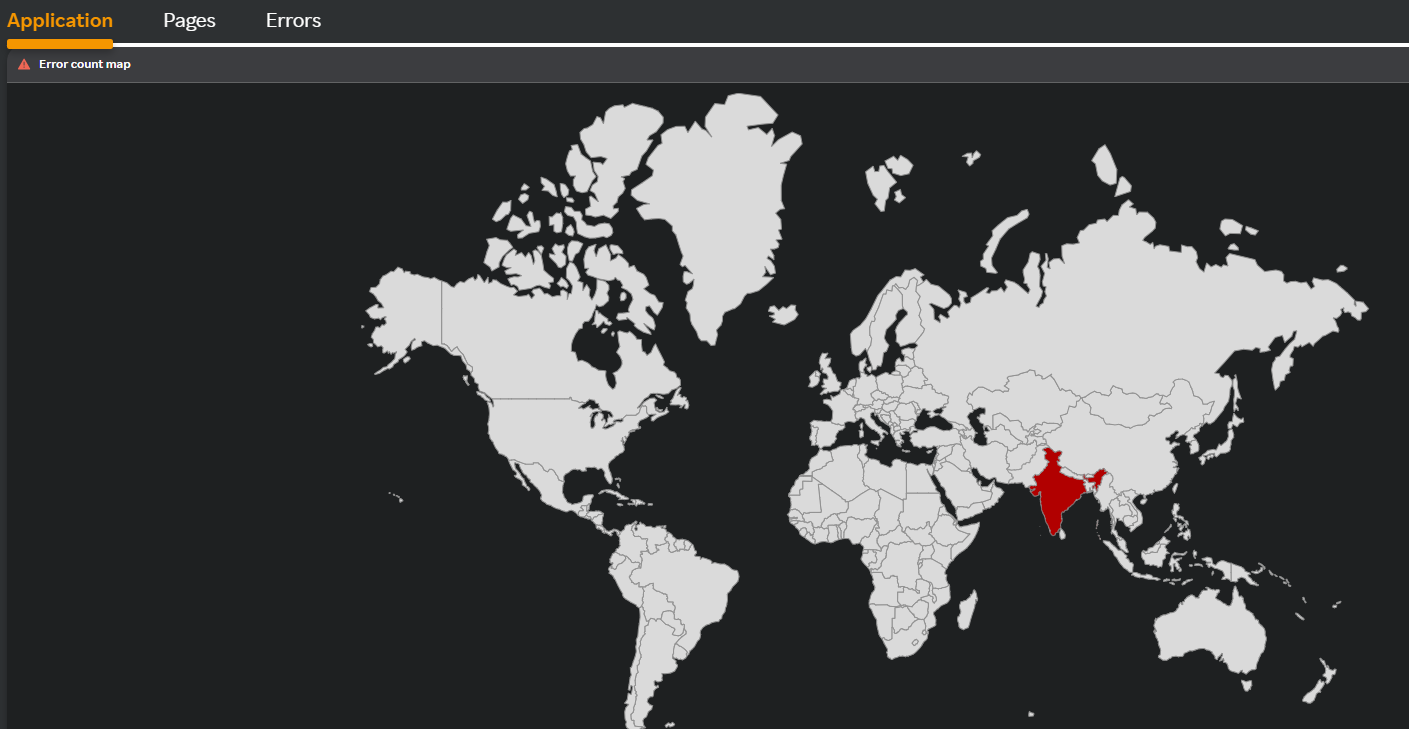
These are vital for the user to understand how a specific application is performing.
Pages
The metrics are monitored for all the pages in the application from which the metrics can be obtained. This tab shows individual metrics for each page so that they can be compared and the focus can be shifted on the pages with poor metrics time.

Click on the page path name, for example "/" in the image to view individual time series metrics for that particular page.
Multi-column Filter
- Multi-column filter can be applied on numeric columns within the Pages Table to refine the displayed data based on specific conditions.
- When the user clicks on the “Filter by” option, user can apply filter below numeric columns
| Field | Description |
|---|---|
| Error % | Percentage of errors occurring on a particular endpoint. |
| Errors | Number of errors occurring on a particular endpoint. |
| Errors/min | Number of errors per minute. |
| Response time (ms) | Response time taken by the endpoint. |
| Calls | Number of calls received at the endpoint. |
| Calls/min | Number of calls received per minute. |
- Each filter condition is applied using the below operators and value ( user input based on the unit)
| Operator |
|---|
| Greater than |
| Less than |
| Equals |
| Greater than or equals |
| Less than or equals |
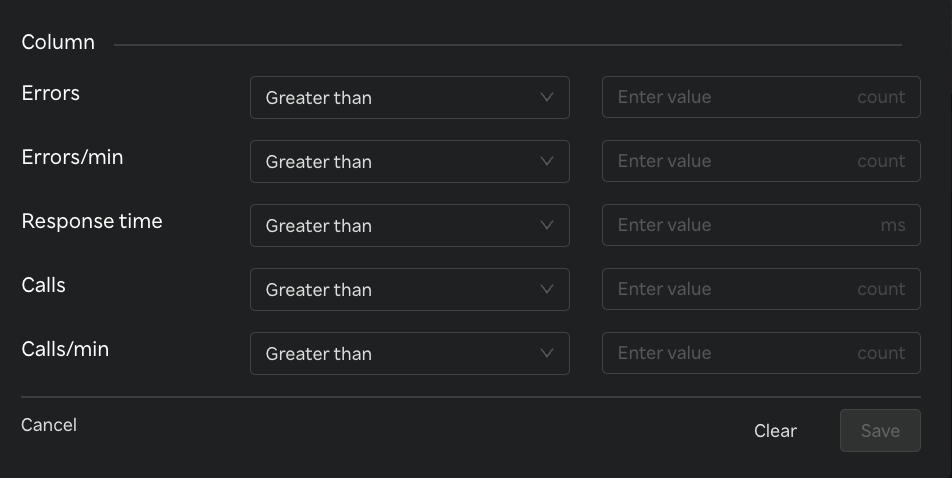
- Once filters & conditions are applied save button is enabled & click "Save" to apply the filter.
- Once filters & conditions are applied it displays no. of filters are applied.
note
- Filters are applied using AND logic — all specified conditions must be met for a record to be displayed.
- Only numeric columns support filtering; non-numeric fields (e.g., text or categorical values) are excluded from the filter options.
- If no records match the selected filters, the table will display a message such as “No data".
- The multi-column filter state persists until the user clears filters by clicking on "Clear" button when Filter by button is clicked.
- A "Reset" button is available to clear all applied filters and restore the table to its original, unfiltered state. This button is enabled only when one or more filters are currently applied.

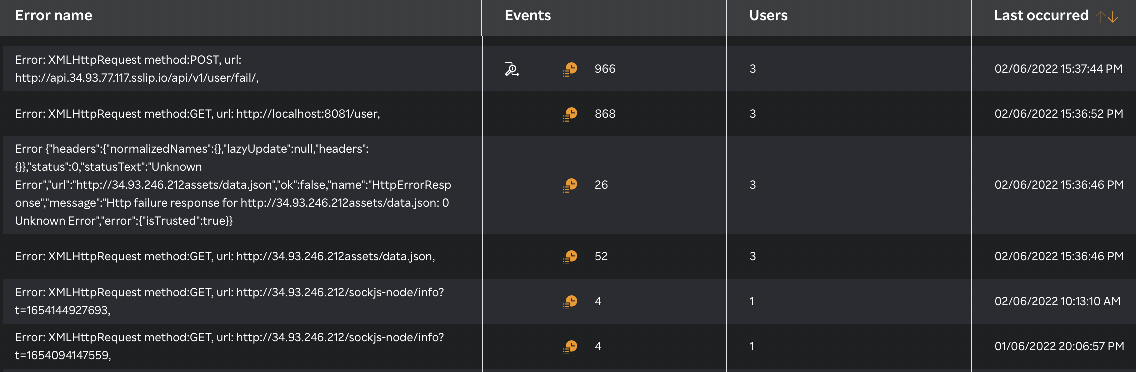
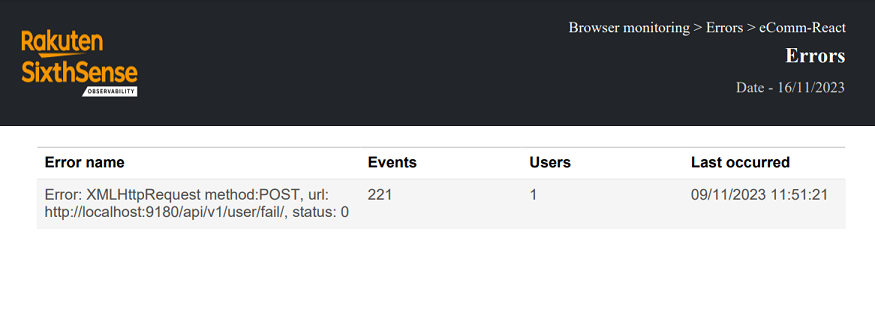
Errors
While viewing the number of errors, clicking on the integer value in the Errors column, for example 3604 in the above image takes you to the Errors tab. You can view the errors that occurred during browsing through the application.
Multi-column Filter
- Multi-column filter can be applied on numeric columns within the Errors Table to refine the displayed data based on specific conditions.
- When the user clicks on the “Filter by” option, user can apply filter below numeric columns
| Field | Description |
|---|---|
| Events | Total number of error events captured in the browser. |
| Users | Number of unique users affected by the errors. |
| Last occurred | Timestamp indicating when the error last occurred. |
- Each filter condition is applied using the below operators and value ( user input based on the unit)
| Operator |
|---|
| Greater than |
| Less than |
| Equals |
| Greater than or equals |
| Less than or equals |
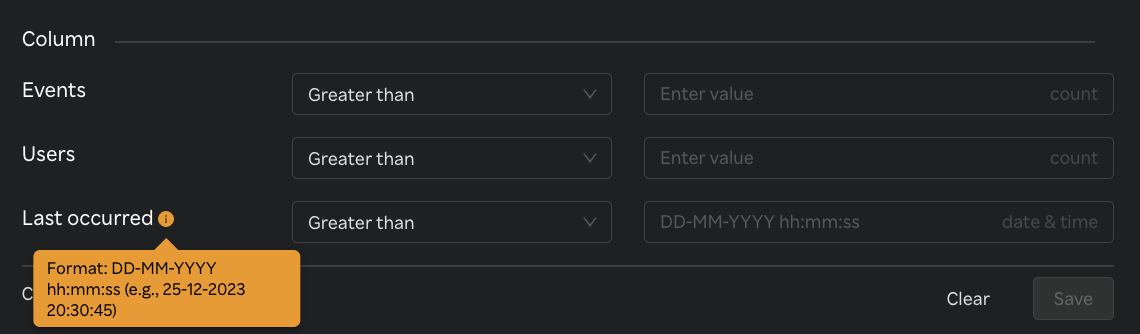
- Once filters & conditions are applied save button is enabled & click "Save" to apply the filter.
- Once filters & conditions are applied it displays no. of filters are applied.
note
- Filters are applied using AND logic — all specified conditions must be met for a record to be displayed.
- Only numeric columns support filtering; non-numeric fields (e.g., text or categorical values) are excluded from the filter options.
- If no records match the selected filters, the table will display a message such as “No data".
- The multi-column filter state persists until the user clears filters by clicking on "Clear" button when Filter by button is clicked.
- A "Reset" button is available to clear all applied filters and restore the table to its original, unfiltered state. This button is enabled only when one or more filters are currently applied.
Downloading reports
Click the  icon to download reports from the Errors page to download the file in PDF format with Error and number of times the error occurred, impacted user count, last occurrence, and application name as in the following screen.
Similarly click the icon under Events and you will see the icon to download the report. The application name, Event ID, OS, Device type, occurrence time, browser and version details are downloaded in PDF format.
Clicking on any event ID in the events page and clicking the icon will download the table as-is along with breadcrumbs in a PDF format.
note
Only the top 100 entries are downloaded if there are more than 100 entries for downloading.
Viewing all events for an error
- Navigate to Browser monitoring > Errors.
- Click the events
 icon under Events column. All the events for a particular error are displayed.
 - Click the Event ID to drill down into the event and view application details, stack trace, breadcrumbs, SDK and user agent.
Sometimes, the cause of the frontend error can be a backend fault. SixthSense Observability's correlation capability allows a synthetic monitoring frontend error to be traced in APM for a backend failure. To do so, click the APM trace ![]() icon next to the Event ID.
icon next to the Event ID.
Multi-column Filter
- Multi-column filter can be applied on numeric columns within the Error Event Table to refine the displayed data based on specific conditions.
- When the user clicks on the “Filter by” option, user can apply filter below numeric columns
| Field | Description |
|---|---|
| Date & time | Timestamp indicating when the error event occurred. |
- Each filter condition is applied using the below operators and value ( user input based on the unit)
| Operator |
|---|
| Greater than |
| Less than |
| Equals |
| Greater than or equals |
| Less than or equals |
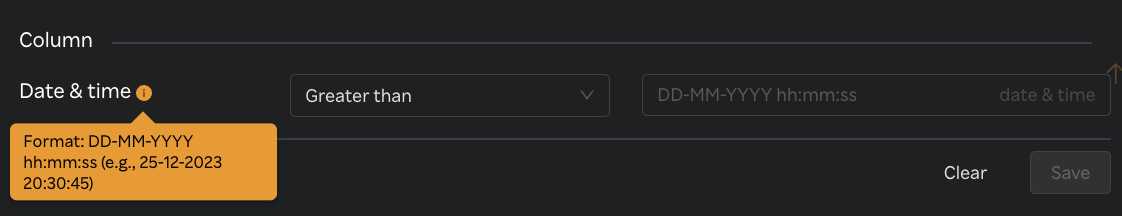
- Once filters & conditions are applied save button is enabled & click "Save" to apply the filter.
- Once filters & conditions are applied it displays no. of filters are applied.
note
- Filters are applied using AND logic — all specified conditions must be met for a record to be displayed.
- Only numeric columns support filtering; non-numeric fields (e.g., text or categorical values) are excluded from the filter options.
- If no records match the selected filters, the table will display a message such as “No data".
- The multi-column filter state persists until the user clears filters by clicking on "Clear" button when Filter by button is clicked.
- A "Reset" button is available to clear all applied filters and restore the table to its original, unfiltered state. This button is enabled only when one or more filters are currently applied.
You can navigate to the APM > Trace page where the backend error trace can be viewed. This feature is only available if you have a license to both SixthSense APM and Browser monitoring.