AWS dashboard
- Navigate to Cloud monitoring on the left pane in the Observability portal.
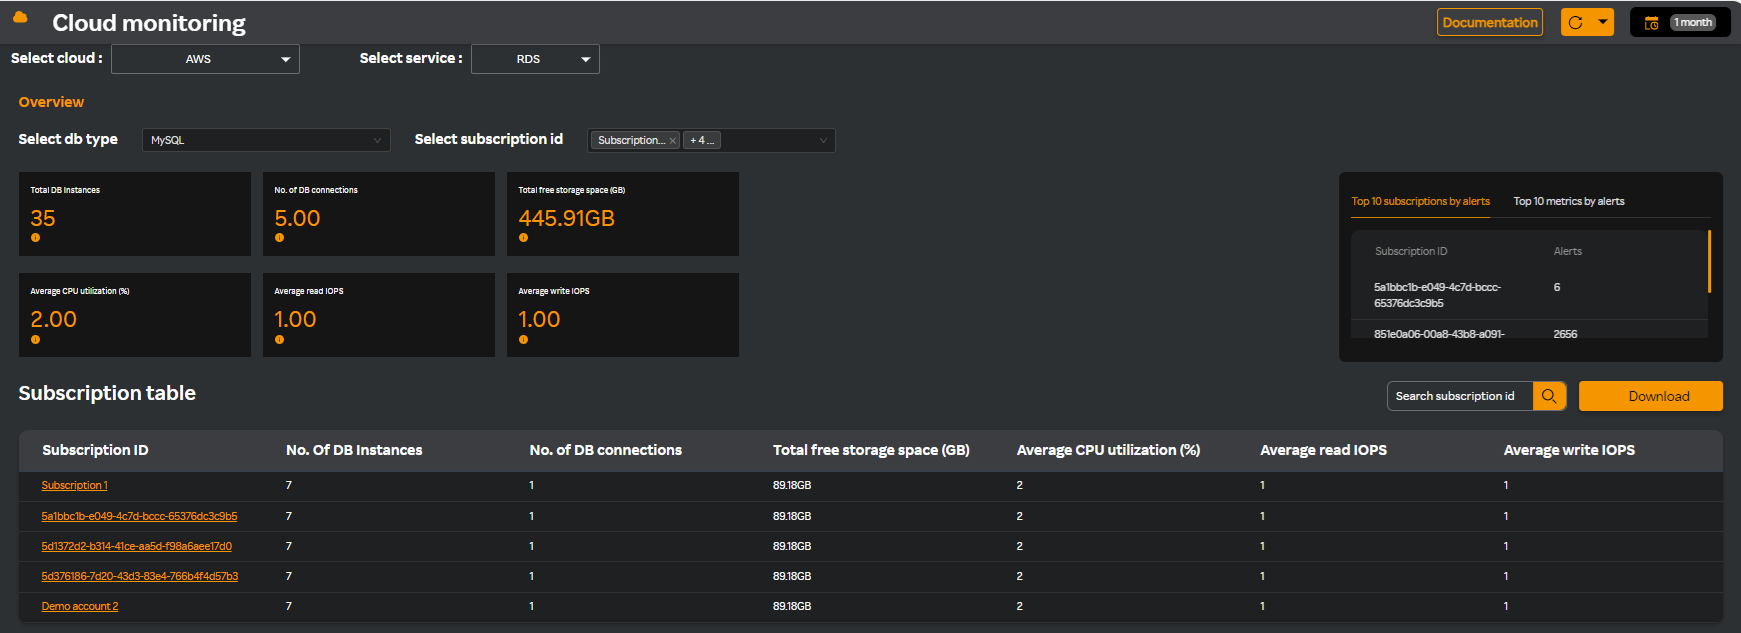
The Overview dashboard appears similar to the following screen.
- Select AWS cloud from the Select cloud drop-down list.
- Select RDS service from the Select service drop-down list.
- Select MySQL database type from the Select DB type drop-down list.
- Select a subscription id from the Select subscription ID drop-down list.
The following cards are displayed in the dashboard.
| Card name | Description |
|---|---|
| Total DB instances | Total number of database instances for all the selected subscriptions. |
| No. of DB connections | Total number of database connections for all the selected subscriptions. |
| Total free storage space (MB) | Total free storage space for all the selected subscriptions. |
| Average CPU utilization (%) | Average CPU utilization for all the selected subscriptions. |
| Average read IOPS | Average read input output per second for all the selected subscriptions. |
| Average write IOPS | Average write input output per second for all the selected subscriptions. |
- Select either Top 10 subscriptions by alerts or Top 10 metrics by alerts. These options display the alerts by Subscription ID or by metrics. For more information about configuring AWS alerts, see AWS alerts.
note
Top 10 subscriptions by alerts is selected by default.
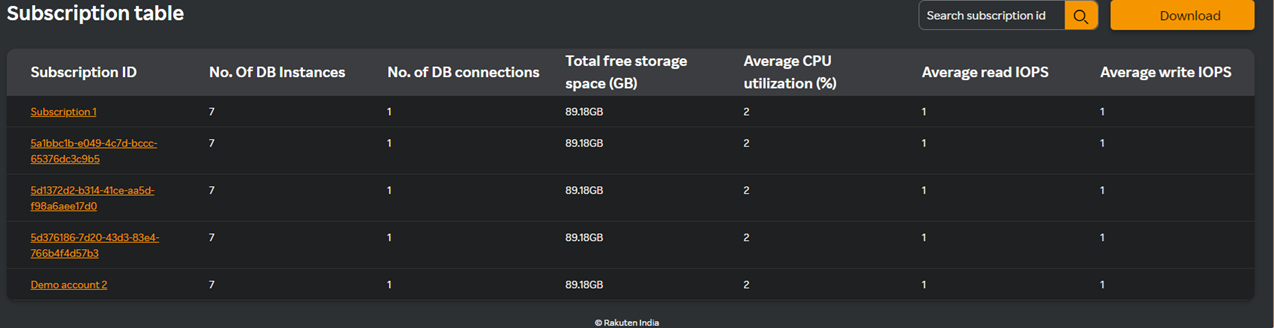
- Search for a subscription ID if you know the ID, in the Search subscription ID field available in the Subscription table header.
- Click Download, to download the subscription detail report in PDF format.
The list of subscriptions along with its details are available in a table format similar to the following screen.
The following columns are displayed.
| Column name | Description |
|---|---|
| Subscription ID | The ID associated with your subscription to a particular product or service. |
| No. of DB instances | The number of managed database environments created through Amazon RDS. |
| No.of DB connections | The number of database connections that a DB instance in AWS can handle. |
| Total free storage space (GB) | The total free storage space available in an Amazon RDS DB instance. |
| Average CPU utilization (%) | Average percentage of CPU resources that a DB instance or other AWS resource uses over a specific period. |
| Average read IOPS | The average number of read operations that your DB instance or another storage resource performs per second. |
| Average write IOPS | The average number of write operations that your DB instance or another storage resource performs per second. |
Viewing databases
- Click on a subscription ID in the Subscription table pane, and you will see a screen similar to the following where you will see the various cards, database instances and their details in the Database instances pane, and the metrics in graph format for the selected subscription ID.
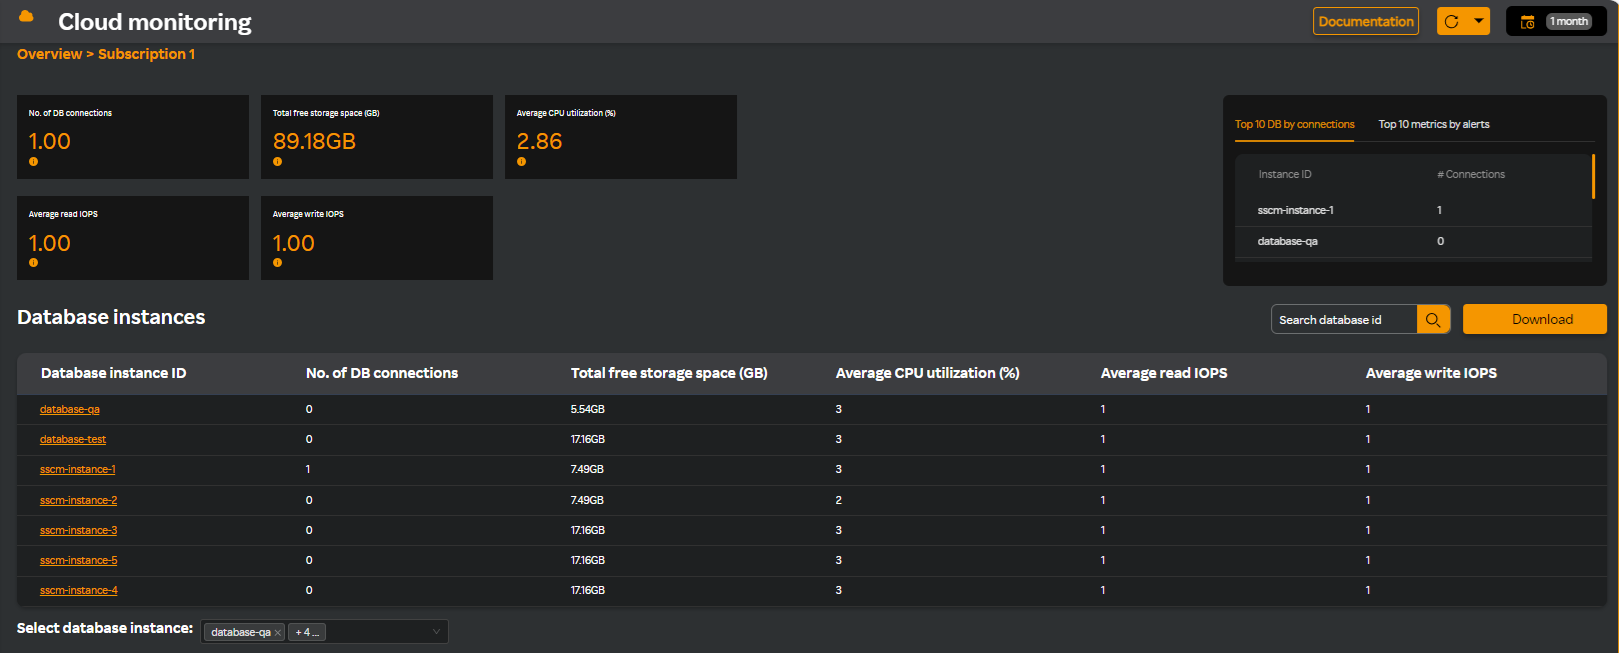
- Select either Top 10 DB by connections or Top 10 metrics by alerts. These options display the top 10 DB by connections or top 10 metrics by alerts.
note
Top 10 DB by connections is selected by default.
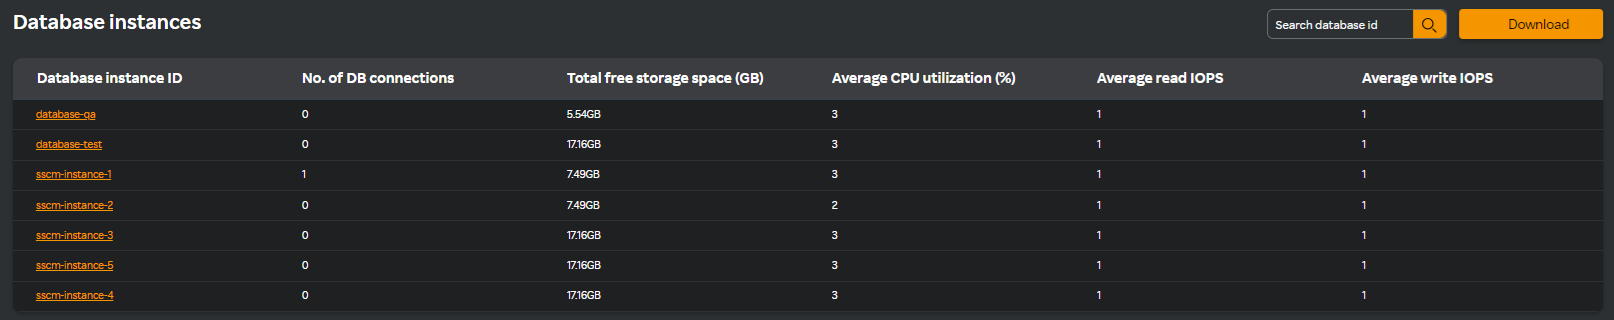
- Search for a database instance in the Search database id field available in the Database instances pane.
- Click Download, to download the database detail report in PDF format.
The list of database instances along with its details are available in a table format similar to the following screen.
The following columns are displayed in the table.
| Column name | Description |
|---|---|
| Database instance ID | The DB Instance Identifier is a unique name that you assign to a DB instance when you create it in Amazon RDS. |
| No. of DB connections | The total count of active connections that are currently open between clients and a database server. |
| Total free storage space (GB) | The amount of available disk space left in your database instance's storage. |
| Average CPU utilization (%) | The average percentage of CPU resources used by a system or application over a specific time period. |
| Average read IOPS | The average number of read operations that your DB instance or another storage resource performs per second. |
| Average write IOPS | The average number of write operations that your DB instance or another storage resource performs per second. |
- Select a database instance or multiple instances from the Select database instance field.
You will see the following metric widgets in a graph format.
DB connections
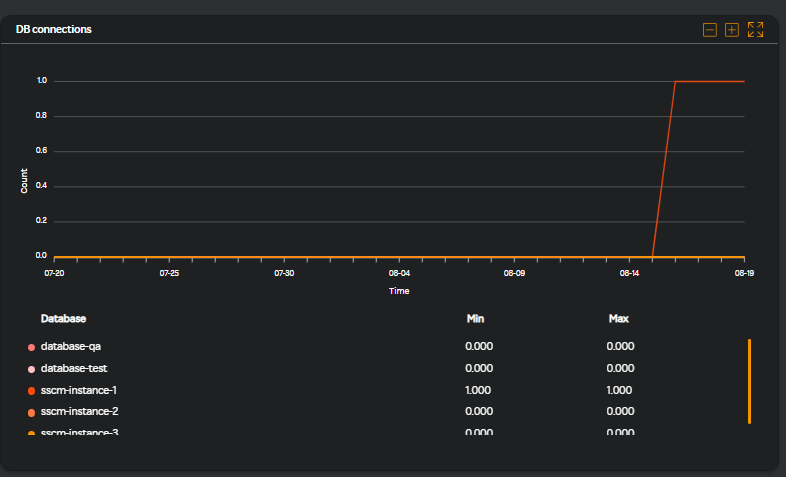
This graph displays the number of database connections for the selected database instances.
DB CPU utilization (%)
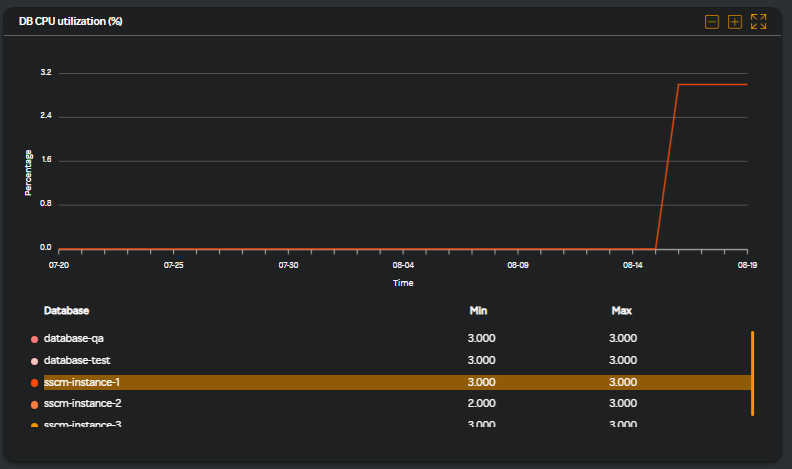
This graph displays the CPU utilization for the selected database instances in percentage.
- Click on a database instance id in the Database instances pane and you will see the instance level metrics similar to the following screen.
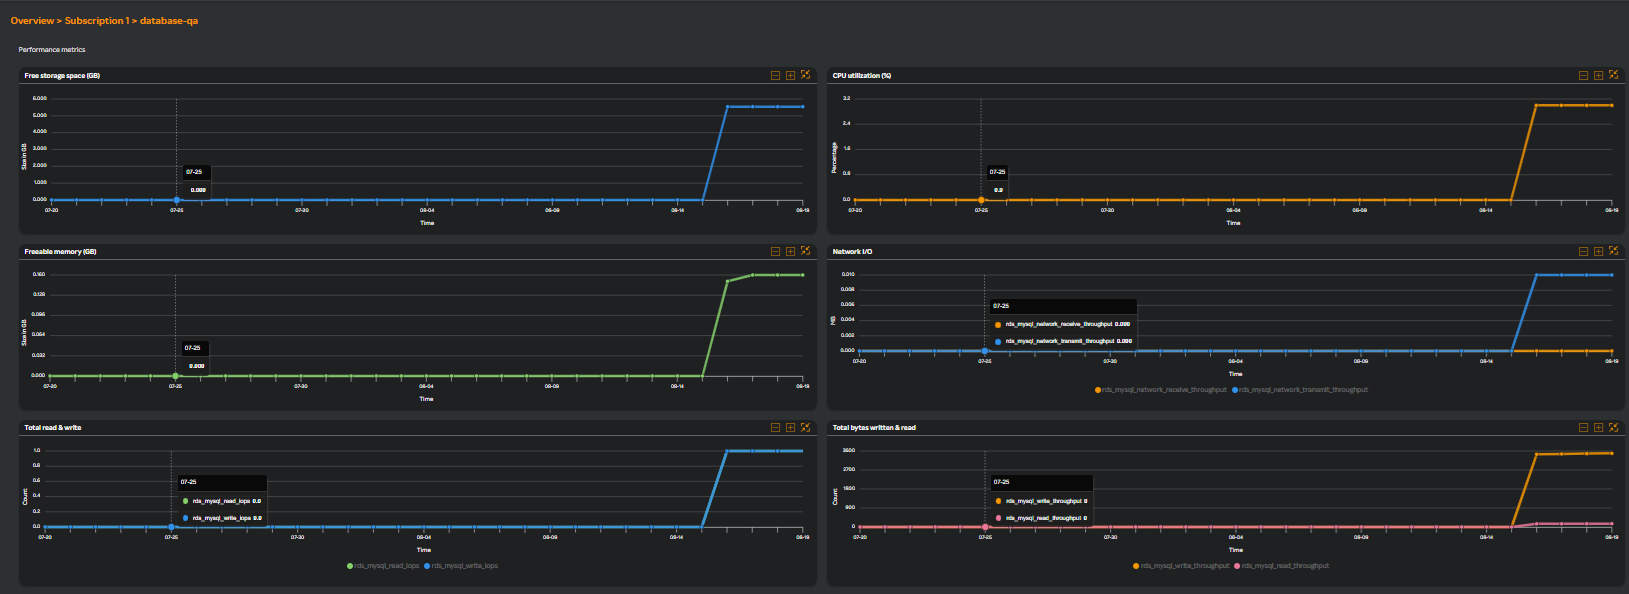
Performance metrics
| Metric name | Description |
|---|---|
| Free storage space (MB) | Indicates the amount of available storage space (in bytes) on your RDS instance. |
| CPU utilization (%) | Measures the percentage of CPU resources that your database instance is using. Monitoring this metric is crucial for ensuring that your database instance has enough processing power to handle the workload efficiently. |
| CPU utilization (%) | Measures the percentage of CPU capacity currently being used by your database instance. This metric is essential for monitoring the performance and resource usage of your RDS instance ensuring adequate handling of workload. |
| Freeable memory (MB) | Tracks the amount of available RAM (in bytes) on your database instance. This metric helps you understand how much memory is free for your database operations ensuring enough memorty to adequately handle workload. |
| Network I/O | Measures the amount of data being transferred in and out of your RDS instance over the network. This metric helps understand how much network bandwidth your database instance is using and ensures that it has sufficient capacity to handle the data flow between your database and other services or applications. |
| Total read & write | Measures the number of read and write operations performed by your database instance per second. This helps understand the performance and efficiency of your database's storage subsystem. |
| Total bytes written & read | Measures the amount of data (in bytes) read from and written to your database instance's storage. This helps in understanding the database's I/O activity and performance. |
| Read I/O operations per second | Measures the number of read operations performed by your database instance per second. This helps assess the performance of your database's read operations and understands the load on your storage system. |
| Write I/O operations per second | Measures the number of write operations performed by your database instance per second. This helps assess the performance of your database's write operations and understands the load on your storage system. |
| I/O operations waiting for disk access | Measures the number of I/O operations (read and write) that are waiting in the queue to be processed by the storage system. It indicates the level of contention or delay for disk access. |
| Milliseconds per read I/O operation | Measures the average time (in milliseconds) it takes to complete a read operation from the storage. This metric helps understand the performance of your database's read operations and how quickly data is being retrieved from storage. |
| Milliseconds per write I/O operation | Measures the average time (in milliseconds) it takes to complete a write operation to the storage. This metric helps understand the performance of your database's write operations and how efficiently data is being written to storage. |
| Swap usage | Measures the amount of swap space being used by your database instance. Monitoring swap usage is important because excessive use of swap can indicate memory pressure, which can lead to performance degradation. |
| Net connection errors per sec | Measures the number of errors encountered when attempting to establish connections to the database instance per second. This metric helps understand the reliability of connections to your database and identifies potential network or configuration issues that might be preventing successful connections. |
| Net connection errors | Represents the count or rate of errors that occur when establishing connections to a database instance. Monitoring connection-related metrics and logs can help you identify and troubleshoot these errors. |
| Prepared statements per second | Refers to the rate at which prepared statements are executed per second on a database instance. |
| Prepared statements | Refers to the tracking of SQL prepared statements within a database, which are SQL queries that are precompiled and stored on the database server to improve performance and security. |
| Database connections | Refers to the number of active connections currently open to a database instance. This metric is crucial for understanding the load on your database and ensuring that it operates within its connection limits. |
Read replica metrics
| Metric name | Description |
|---|---|
| Replica lag | Measures the delay between the primary (source) database and its read replica. This metric indicates how much time (in seconds) it takes for changes made on the primary database to be reflected on the replica. |
| Bin log disk usage | Measures the amount of disk space consumed by binary logs (binlogs) on an RDS instance. |
note
AWS Cloud Watch does not give metrics in real time. There will be a delay of 2 minutes. So you will always see data only after 2 minutes.