GKE dashboard
Login to the SixthSense portal and click Cloud monitoring on the left pane. The Cloud monitoring dashboard is displayed.

By default, the following fields are available.
- GCP is selected in the Select cloud drop-down list.
- GKE is selected in the Select service drop-down list.
- Select the cluster for which you want to view data in the Select cluster drop-down list.
The GKE data visualization is done in the same way as deployment. Summary view at the node level, pod level, and the container level are visible.
Nodes
The Nodes tab lists the following metrics and information in the Metrics window.
- Cluster cpu cores – total CPU cores allocated to the selected cluster.
- Cluster cpu allocatable cores – total core which can be allocated to the cluster.
- Cluster cpu utilization % - total CPU usage in percentage at a cluster level.
- Cluster nodes total - represents the number of nodes deployed in a cluster.
- Cluster memory total – represents the total memory allocated to the cluster in GiBs.
- Cluster memory used – represents the amount of memory used by cluster in GiBs.
- Cluster storage total – represents the amount of cluster storage.
- Cluster storage used - represents the amount of cluster storage used in GiBs.

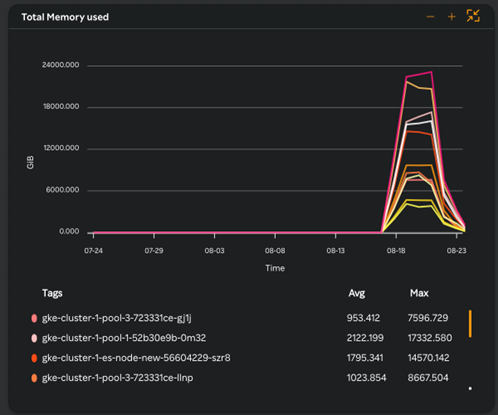
Total Memory used
This is a graph widget which represents cluster level memory used in GiB. It also lists the cluster names under Tags and Avg and Max usage.
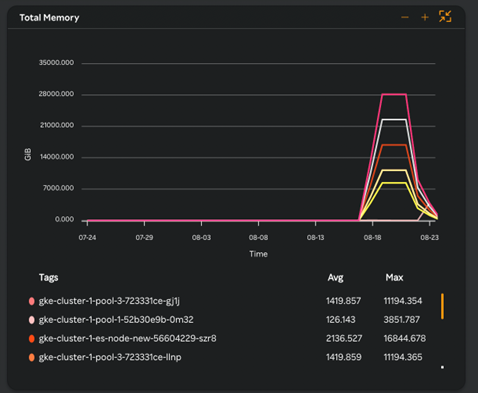
Total Memory
This is a graph widget which represents cluster level memory available in GiB. It also lists the cluster names under Tags and Avg and Max usage.
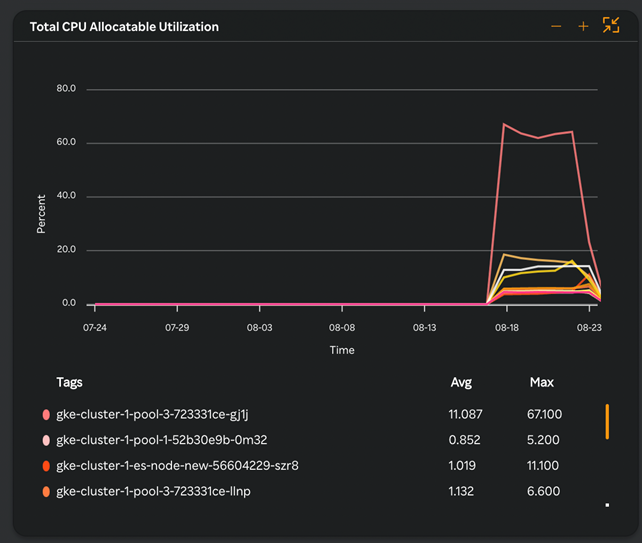
Total CPU Allocatable Utilization
This is a graph widget which represents cluster level total allocatable CPU available in percentage. It also lists the cluster names under Tags and Avg and Max usage.
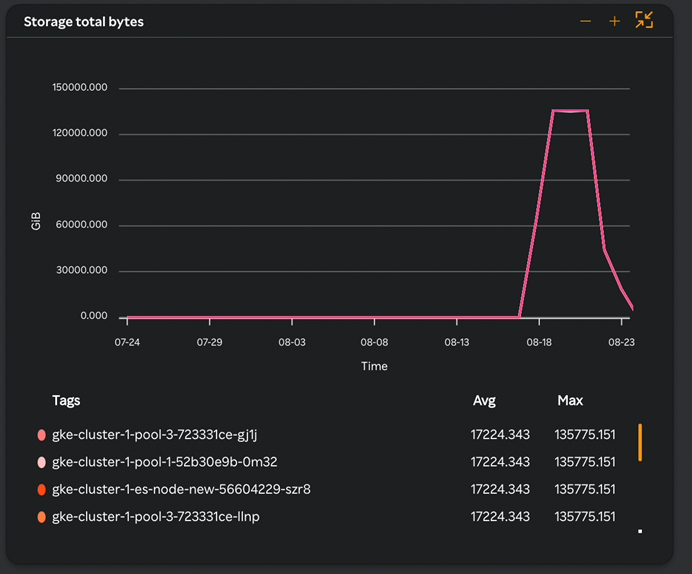
Storage total bytes
This is a graph widget which represents cluster level storage allocated in bytes. It also lists the cluster names under Tags and Avg and Max usage.
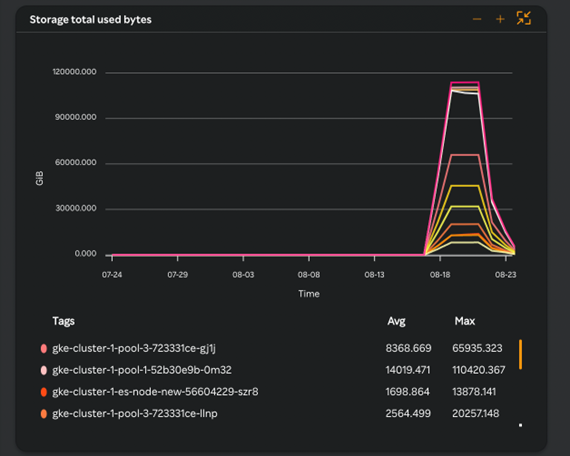
Storage total used bytes
This is a graph widget which represents cluster level total storage used in bytes. It also lists the cluster names under Tags and Avg and Max usage.
Pods
At a pod level the following metrics and information are listed.
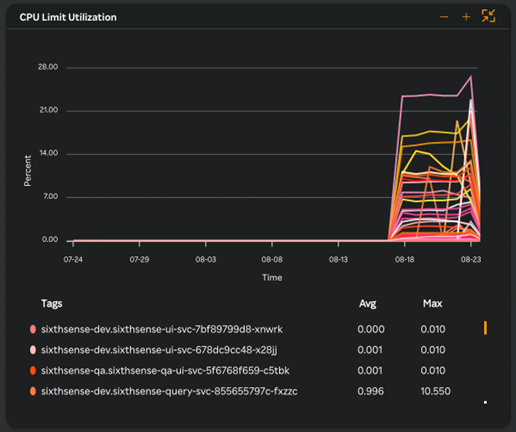
CPU Limit Utilization
This is a graph widget which represents pod level CPU used in percentage. It also lists the pod names under Tags and Avg and Max usage.
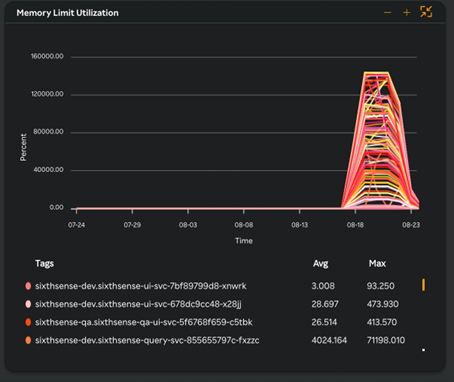
Memory Limit Utilization
This is a graph widget which represents pod level memory used in percentage. It also lists the pod names under Tags and Avg and Max usage.
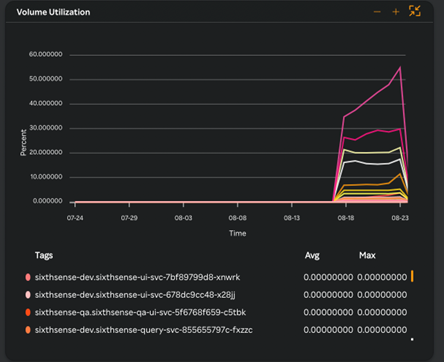
Volume Utilization
This is a graph widget which represents pod level volume used in percentage. It also lists the pod names under Tags and Avg and Max usage.
Containers
At the container level the following metrics and information are listed.
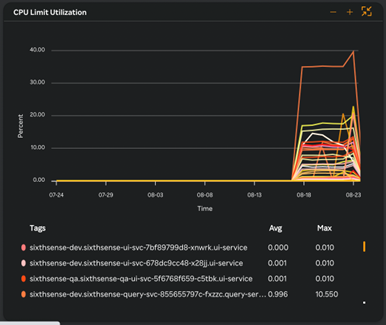
CPU Limit Utilization
This is a graph widget which represents container level CPU used in percentage. It also lists the container names under Tags and Avg and Max usage.
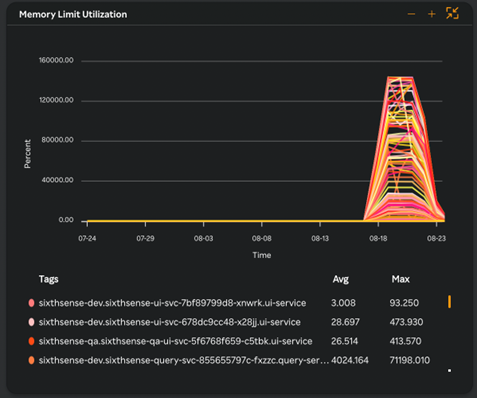
Memory Limit Utilization
This is a graph widget which represents container level memory used in percentage. It also lists the container names under Tags and Avg and Max usage.
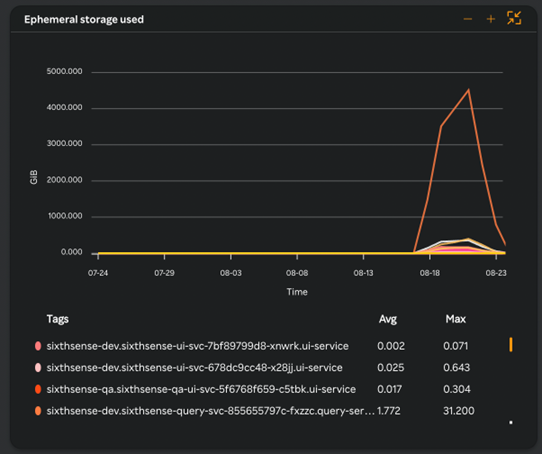
Ephemeral storage used
This is a graph widget which represents container level Ephemeral storage used in percentage. It also lists the container names under Tags and Avg and Max usage.
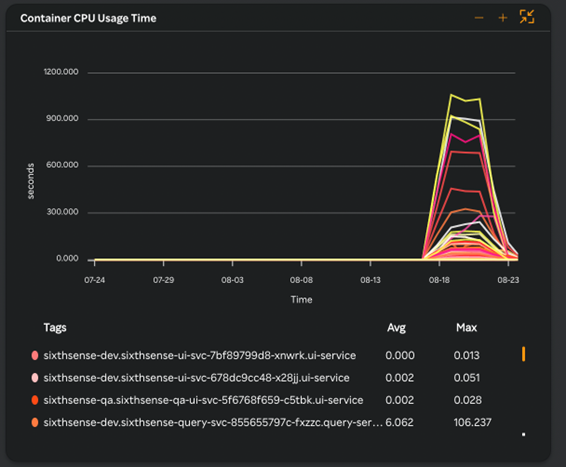
Container CPU Usage Time
This is a graph widget which represents container level CPU used in milliseconds. It also lists the container names under Tags and Avg and Max usage.
