Usage dashboard
Role: Service/Application owners, Business owners, SRE, and DevOps.
- Navigate Usage on the left pane in the SixthSense portal page The Usage dashboard page appears.
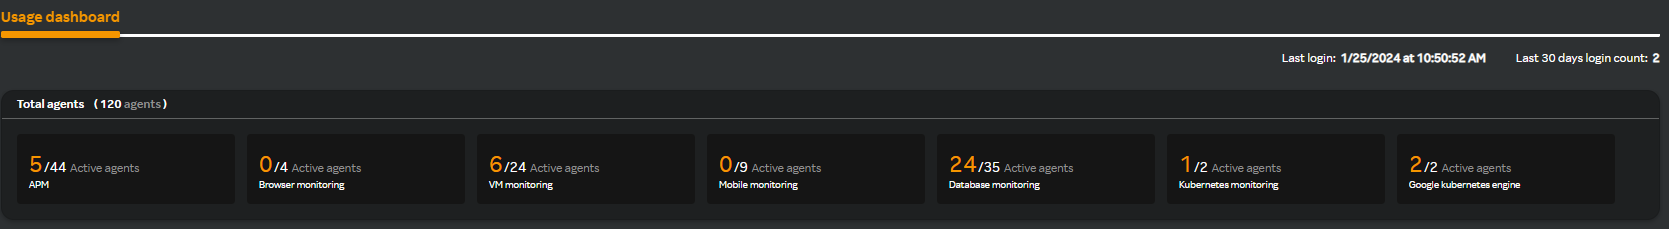
The top banner contains your last login date and time and the last 30 days login count. The dashboard contains the following widgets.
Total agents
This widget displays the total number of agents across all capabilities in the top banner. In the following screen for example, the total agents are 120. The nodes below display the total and active agents for each capability.
Current month usage
The current month usage displays the total GB used by all capabilities and also GB used individually by each capability in a graph format.
Graph view
This view by default displays the current month data. You can also compare the current month data with the previous two months by selecting the checkbox against the month name in the header. The following screen contains the current month data.
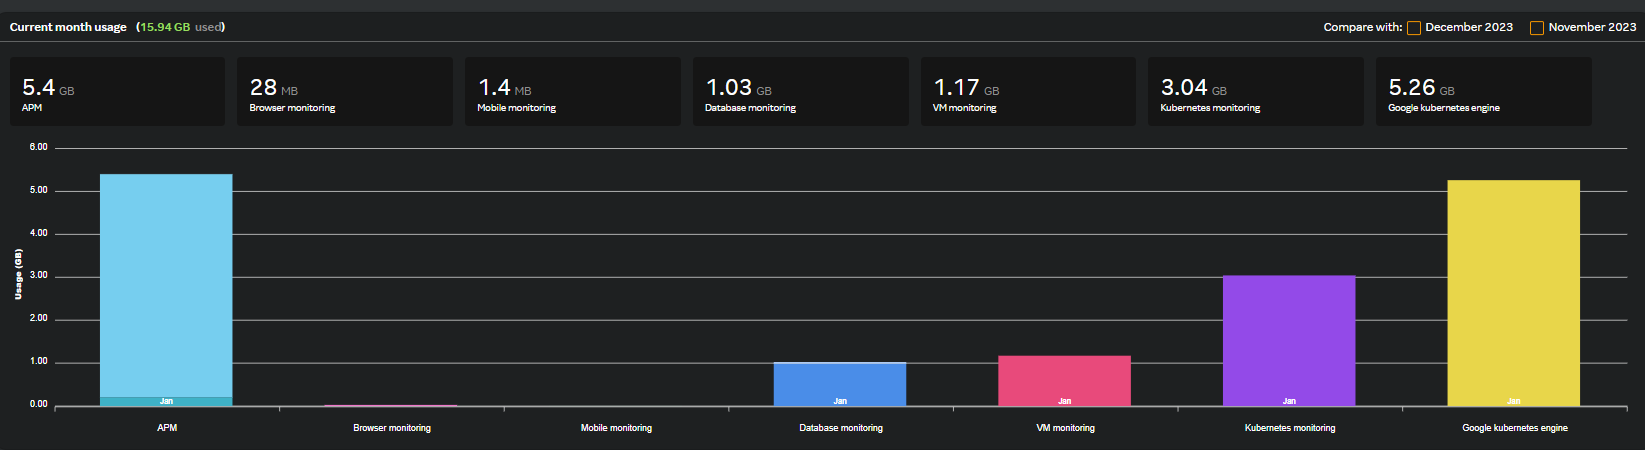
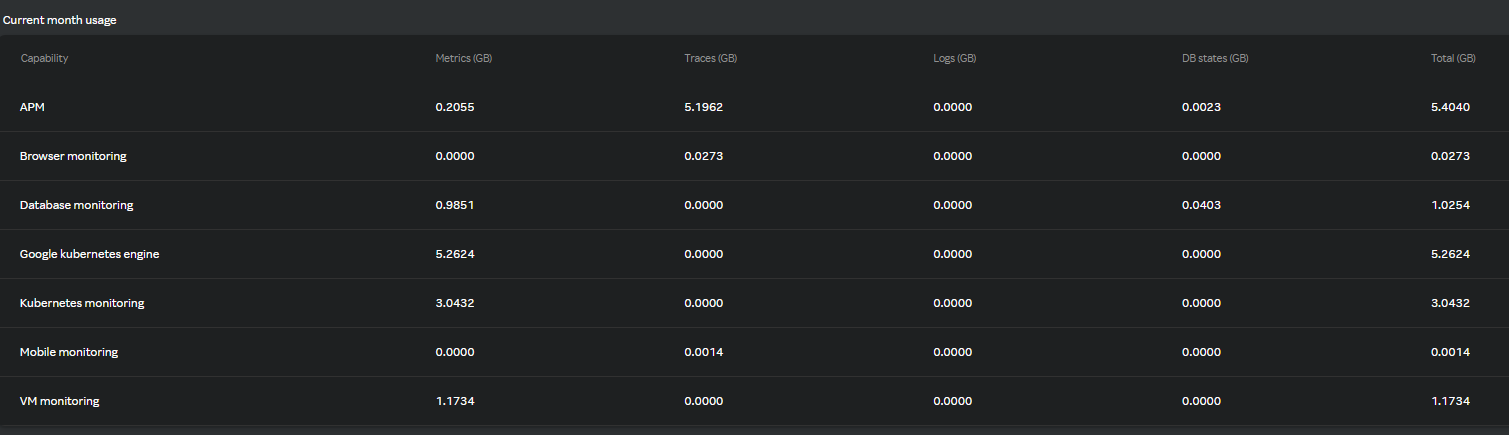
Table view
The current month usage displays the metrics that was ingested at what quantity for each capability such as Metrics, Traces, Logs, and DB states. The Total column displays the total of all metrics by capability as in the following screen.