- Navigate to MQ monitoring on the left pane in the Observability portal.
- Select Kafka from the Message queue drop-down list.
- Click Consumer to view the consumer related details.
A screen similar to the following appears.
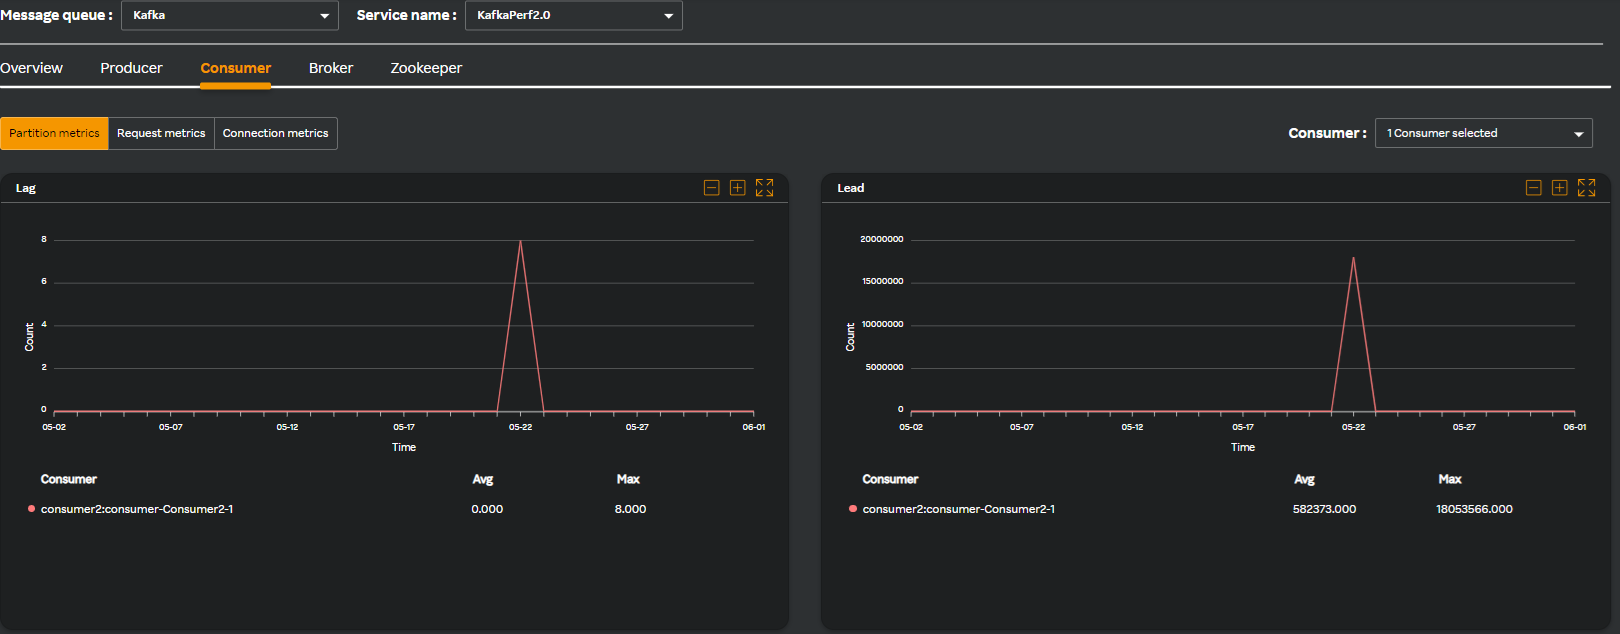
By default, the **Partition metrics** tab under it is selected and the following widgets are available for you to comprehend metrics in a graph format.
| Widget name | Description |
|---|
| Log | Provides insights into how data is being logged, retained, and accessed within the Kafka cluster. |
| Lead | Ensure that leaders are properly distributed across brokers. |
- Click the Request metrics tab. It contains the following widgets which lets you comprehend the metrics in a graph format.
| Widget name | Description |
|---|
| Incoming bytes | Total number of bytes received by the Kafka broker in incoming requests. |
| Outgoing bytes | Total number of bytes sent by the Kafka broker in outgoing responses. |
| Average fetch latency | Average time taken for a Kafka consumer to fetch messages (records) from a Kafka broker. |
| Maximum fetch latency | Maximum time taken for a Kafka consumer to fetch messages (records) from a Kafka broker. |
- Click the Connection metrics tab. It contains the following widgets which lets you comprehend the metrics in a graph format.
| Widget name | Description |
|---|
| Connection creation rate | Rate at which new client connections are established with the Kafka broker. |
| Connection close rate | Rate at which client connections are closed or disconnected from the Kafka broker. |
| I/O wait ratio | Ratio of time spent waiting for I/O operations to the total processing time. |
| I/O wait time average | Average time spent waiting for I/O operations, such as disk reads or writes, within the Kafka broker. |