Trends
Trends allows you to plot data from people, events, and properties. It helps you find patterns in your data, as well as monitors your product ensuring everything is running.
Benefits of Trends
- Tracks how your metrics changes over time.
- Compares the usage of different features side-by-side.
- Determines how a specific change affects usage or engagement with your product.
- Identifies long-term patterns or cycles in your usage.
- Creates cohorts of users easily based on when they performed events.
- Analyzes how the properties of events vary over time using aggregation (sum, average, etc).
The Trends tab in the Digital experience page is selected by default.
- Select a product from the list of available products in the Search product drop-down list.
- Select an URL from the Search path drop-down list. All the URLs that this application has are displayed.
- Select a browser from the Select browser drop-down list.
Adding metrics
Add the relevant metrics if you are using the capability for the first time. By default, none of the metrics are selected.
- Click the Add Metrics icon.
The available metrics are as in the following screen.
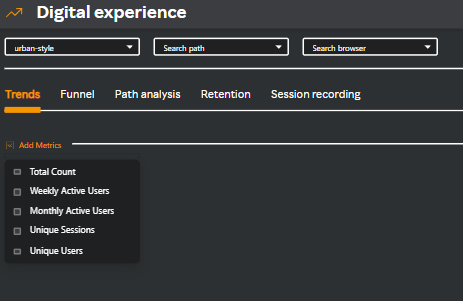
- Select the metrics you want to add. The selected metrics are displayed as cards.
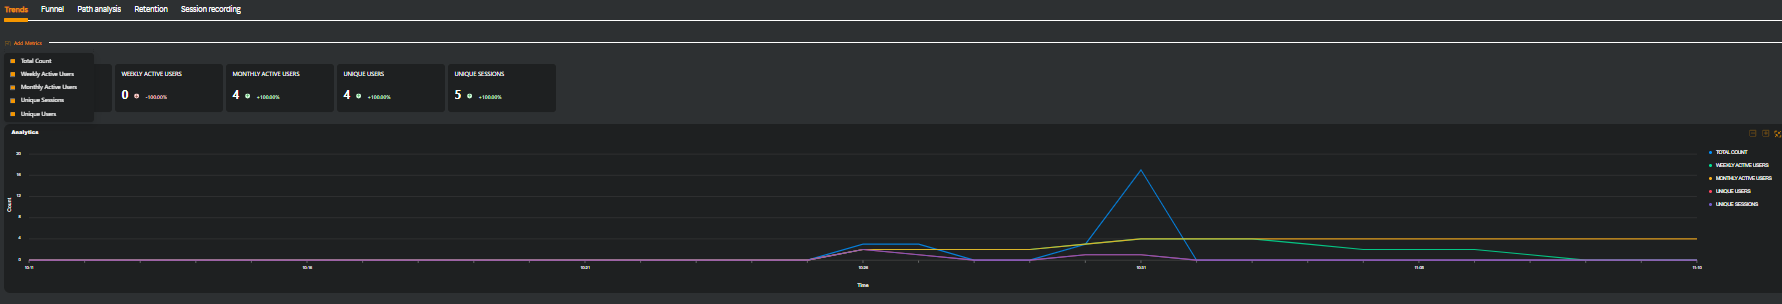
For example, the following screen displays all the selected metrics as cards.
| Card name | Description |
|---|---|
| TOTAL COUNT | The total number of times this event was performed in a given period. |
| WEEKLY ACTIVE USERS | The total number of unique users who have performed this event within the last 7 days. This is a rolling count for each period, counting the previous 7 days. |
| MONTHLY ACTIVE USERS | The total number of unique users who have performed this event within the last 30 days. This is a rolling count for each period, counting the previous 30 days. |
| UNIQUE SESSIONS | The total number of unique sessions within the given period where this event was performed. |
| UNIQUE USERS | The total number of unique users who have performed this event in a given period. Example: If the same user performs an event twice, this will only count it as 1. |
Analytics widget
This widget is a graphical representation of the metrics you have selected for the number of days you have selected in the calendar on the top right corner of the Digital experience page.