Producer
- Navigate to MQ monitoring on the left pane in the Observability portal.
- Select Kafka from the Message queue drop-down list.
- Click Producer to view the producer related details similar to the following screen.
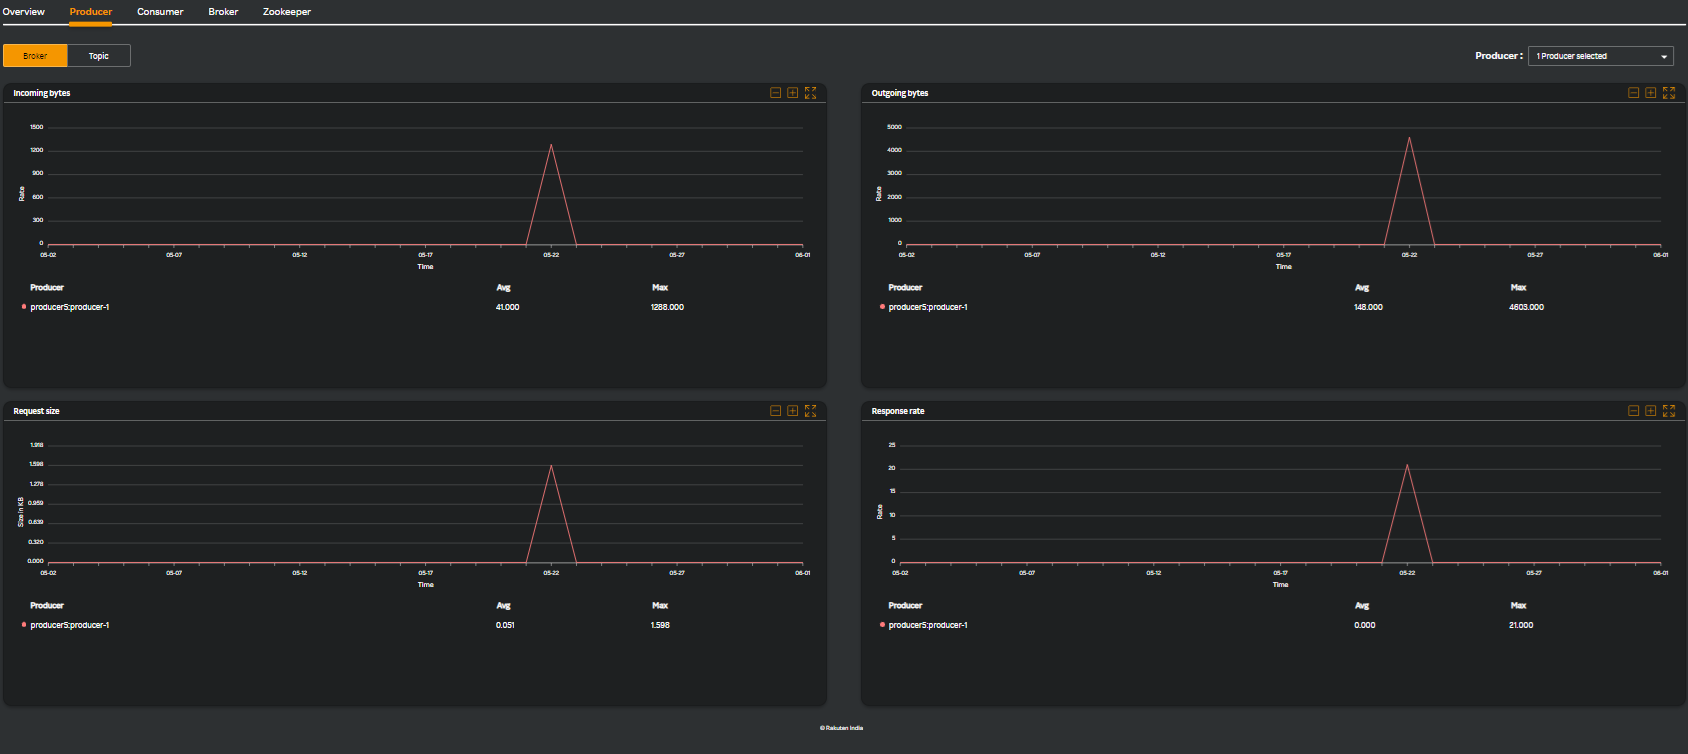
By default, the Broker tab under that is selected and the following widgets are available for you to comprehend metrics in a graph format.
The Broker tab contains the following widgets which lets you comprehend the metrics in a graph format.
| Widget name | Description |
|---|---|
| Incoming bytes | Total amount of data (in bytes) that is received by a Kafka broker from producers or other brokers within the Kafka cluster. |
| Outgoing bytes | Total amount of data bytes that is sent out by a Kafka broker to consumers, other brokers, or external systems. |
| Request size | Size of requests received by the broker from producers, consumers, or other brokers. |
| Response rate | Rate at which the broker sends responses to requests from producers, consumers, or other brokers. |
- Click the Topic tab. It contains the following widgets which lets you comprehend the metrics in a graph format.
| Widget name | Description |
|---|---|
| Record send rate | Rate at which records (messages) are sent to a specific topic. |
| Record send total | Total number of records (messages) sent to a specific topic by producers. |
| Record error rate | Rate at which errors occur when producers attempt to send records (messages) to Kafka topics. |
| Record error total | Total errors encountered by a producer when attempting to send records (messages) to Kafka topics. |