Ingress dashboard
- Login to the SixthSense portal.
- Click Cloud Monitoring on the left pane.
- Select AWS in the Select cloud drop-down list.
- Select INGRESS in the Select service drop-down list.
- Select a connection name from the Select connection name drop-down list.
A screen similar to the following appears.
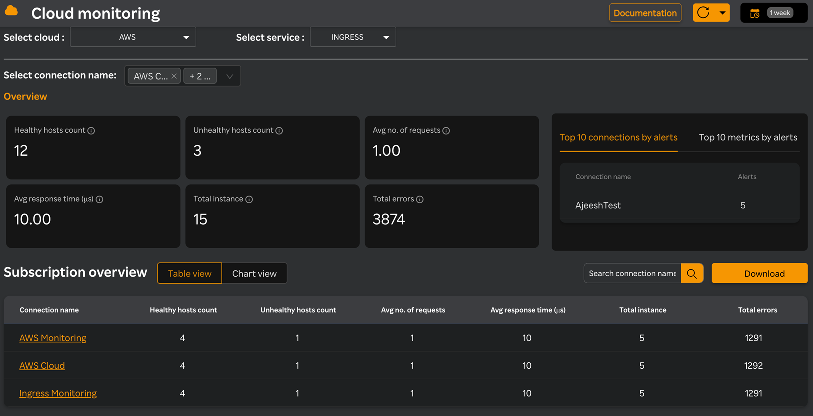
The Overview pane consists of the following cards:
| Card name | Description |
|---|---|
| Healthy hosts count | The number of targets that are considered healthy. |
| Unhealthy hosts count | The number of targets that are considered unhealthy. |
| Avg. no. of requests | Refers to the invocations of a Ingress function. Each time a Ingress function is triggered, an execution occurs, and AWS monitors and tracks these events. |
| Avg. response time | Refers to execution failures during the invocation of a Ingress function. |
| Total instance | The total number of backend server instances (EC2 instances or containers) registered with the load balancer, which it routes traffic to based on the defined load balancing algorithm. |
| Total errors | The cumulative count of failed requests due to issues like misconfigurations, unreachable targets, or unsupported protocols, which can be tracked across different error codes (e.g., 4xx and 5xx errors). |
- Select either Top 10 connections by alerts or Top 10 metrics by alerts. These options display the alerts by connections or by metrics. For more information about configuring AWS alerts, see AWS alerts.
note
Top 10 connections by alerts is selected by default.
- Search for a connection name in the Search connection name field.
- Click the Download tab to download the connection detail report in PDF format.
The Subscription overview pane displays either a Table view or Chart view based on your selection. Table view is selected by default. The list of connections along with its details are available in a table format similar to the following screen.
| Column name | Description |
|---|---|
| Connection name | Relates to identifiers or labels for connections established by your Ingress function. Clicking the connection name will take you to the All functions pane. |
| Healthy hosts count | The number of targets that are considered healthy. |
| Unhealthy hosts count | The number of targets that are considered unhealthy. |
| Avg. no. of requests | Refers to the invocations of a Ingress function. Each time a Ingress function is triggered, an execution occurs, and AWS monitors and tracks these events. |
| Avg. response time | The average duration it takes for the load balancer to process a request and return a response, measured from the moment the request is received until a response is sent. |
| Total instance | The total number of backend server instances (EC2 instances or containers) registered with the load balancer, which it routes traffic to based on the defined load balancing algorithm. |
| Total errors | The cumulative count of failed requests due to issues like misconfigurations, unreachable targets, or unsupported protocols, which can be tracked across different error codes (e.g., 4xx and 5xx errors). |
- Click on any connection name which will take you to the ALB, NLB, and CLB widgets. For more information, see ALB widgets, NLB widgets, and CLB widgets.
Select Chart view to view the chart view similar to the following screen.
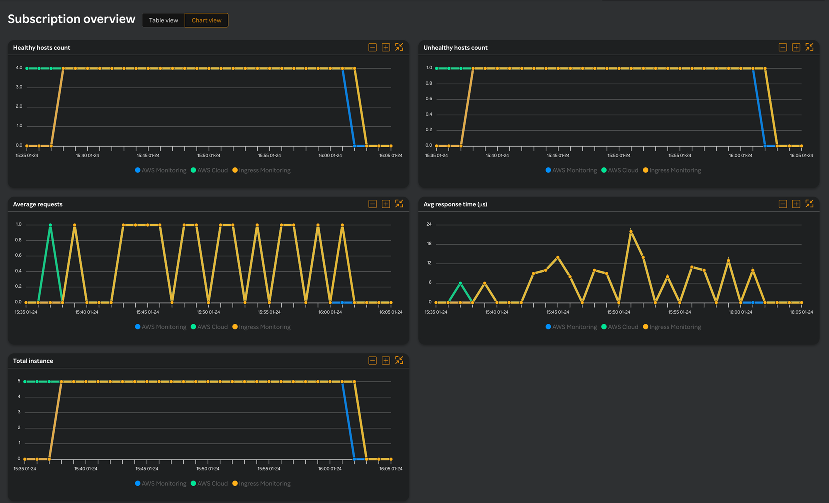
| Widget name | Description |
|---|---|
| Healthy hosts count | The number of targets that are considered healthy. |
| Unhealthy hosts count | The number of targets that are considered unhealthy. |
| Average requests | The number of incoming traffic requests handled by an AWS service or resource over a specific time period. |
| Avg response time | The average duration it takes for the load balancer to process a request and return a response, measured from the moment the request is received until a response is sent. |
| Total instance | The total number of backend server instances (EC2 instances or containers) registered with the load balancer, which it routes traffic to based on the defined load balancing algorithm. |
ALB widgets
| Widget name | Description |
|---|---|
| Total request count | The total number of requests processed by the load balancer. |
| Target response time | The amount of time it takes for a target to process an incoming request and respond back to the client via an AWS service in microseconds |
| Calls per minute | The number of requests sent from ingress to the services in one-minute duration. |
| Errors per minute | The application errors found in the one-minute timeframe, which reports to the ingress resource. |
| Rejected requests | The number of incoming requests that are not processed by a service due to various reasons, such as exceeding limits, security restrictions and so on. |
| http fixed response count | The number of successful fixed-response actions. |
| HTTP 4XX errors | Client-side errors indicating that the client sent a request that the server cannot or will not process. |
| HTTP 5XX errors | Server-side errors indicating that the server failed to process a valid request due to issues on the server itself. |
| Total active connections | The total number of active concurrent Transmission Control Protocol (TCP) connections from clients to the load balancer and from the load balancer to targets. |
| Total processed bytes count | The total number of bytes processed by the load balancer. |
| HTTP 2xx count | The number of HTTP response codes generated by the targets. This does not include any response codes generated by the load balancer. |
| HTTP 3xx count | The number of HTTP response codes generated by the targets. This does not include any response codes generated by the load balancer. |
NLB widgets
| Widget name | Description |
|---|---|
| Rejected requests | Connections or requests that the load balancer cannot process and rejects. |
| Errors per minute | the number of failed requests or issues encountered by the load balancer while processing traffic. |
| Port allocation errors | Occurs when there are issues assigning or using ports for communication between the NLB and its targets. |
| Client TLS negotiation errors | Occur during the handshake phase between the client and the load balancer when establishing a secure HTTPS connection. |
| Total active connections | The total number of active concurrent Transmission Control Protocol (TCP) connections from clients to the load balancer and from the load balancer to targets. |
| Total processed bytes count | The total number of bytes processed by the load balancer. |
| Total negotiation errors | The number of times the TLS or SSL handshake fails during the establishment of a secure connection between clients and the load balancer. |
CLB widgets
| Widget name | Description |
|---|---|
| Total request count | The number of HTTP/HTTPS requests that have been handled by the load balancer. |
| Latency | The amount of time it takes for the load balancer to process a request from the moment it is received to the time the response is sent back to the client in microseconds. |
| Calls per minute | The number of requests sent from ingress to the services in one-minute duration. |
| Errors per minute | The application errors found in the one-minute timeframe, which reports to the ingress resource. |
| HTTP 4XX errors | Client-side errors that occur when a client sends a request to the load balancer, but the request is malformed or unauthorized. |
| HTTP 5XX errors | Server-side issues, which typically occur when the backend servers cannot handle or process requests properly. |
| Total active connections | The total number of active concurrent Transmission Control Protocol (TCP) connections from clients to the load balancer and from the load balancer to targets. |
| Total processed bytes count | The total number of bytes processed by the load balancer. |
| HTTP 2xx count | The number of HTTP response codes generated by the targets. This does not include any response codes generated by the load balancer. |
| HTTP 3xx count | The number of HTTP response codes generated by the targets. This does not include any response codes generated by the load balancer. |