Viewing configured alerts
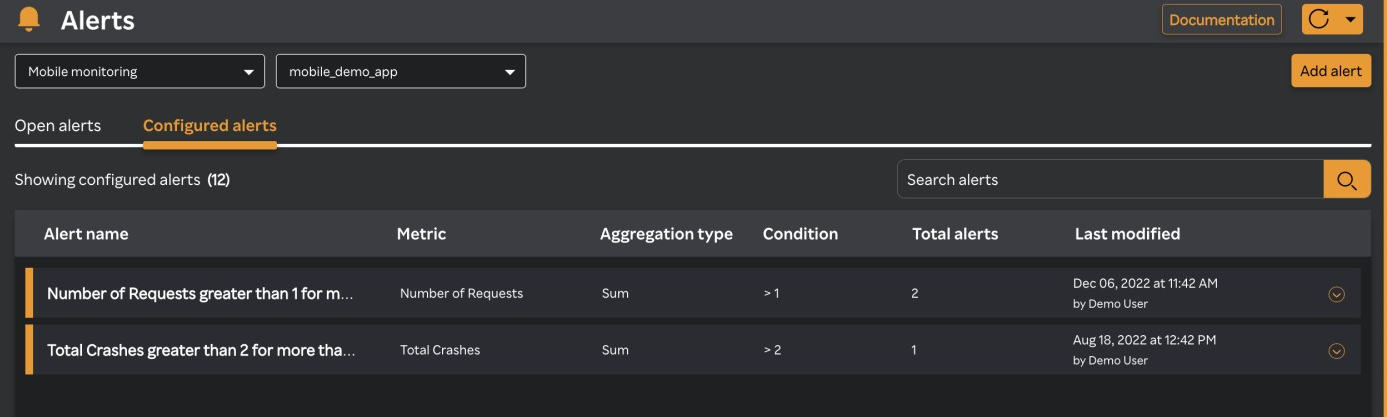
You can view alerts that you have already configured by going to Alerts > Configured alerts. You can view all the alerts that you have already configured for the specified capability and service. For more information about viewing open alerts, see Viewing open alerts.
Login to the SixthSense Observability portal.
Click the Alerts
 icon on the left pane.
Select a capability from the Search capability drop-down list.
Select a service from the Search service drop-down list.
Click the Configured alerts tab.
The list of alerts you have already configured are displayed sorted by the latest triggered alert on the top. Details such as the alert name, metric, aggregation type, condition, total alerts, and the name of the person who modified it last with the timestamp are displayed as in the following screen.
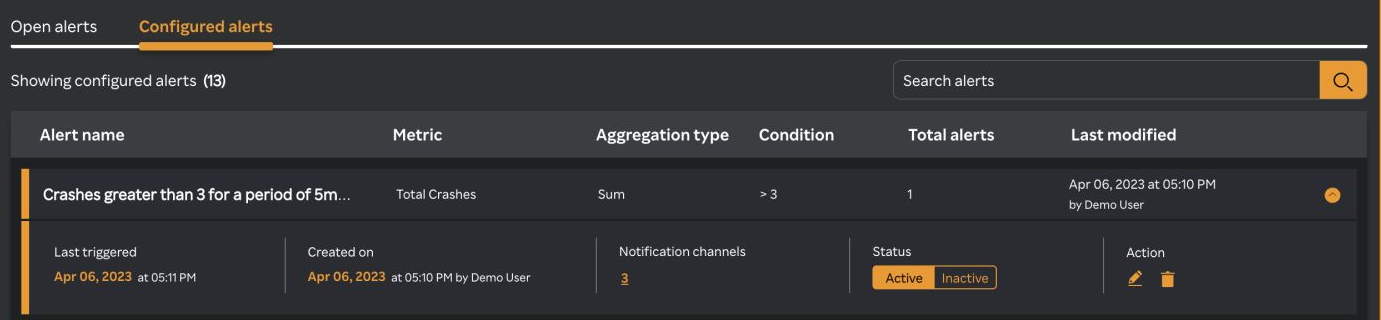
Click the expand
 icon next to an alert to view alert details as displayed in the following screen.
note
You can activate an inactive alert or inactivate an active alert from this screen. For more information, see Activating an inactive alert and Inactivating an active alert.
Viewing alerts by read-only platform user
A read-only platform user can view the alerts to see the alert configuration.
To view the configured alerts, perform the following the procedure.
- Navigate to Alerts > Configured alerts. The following screen appears.
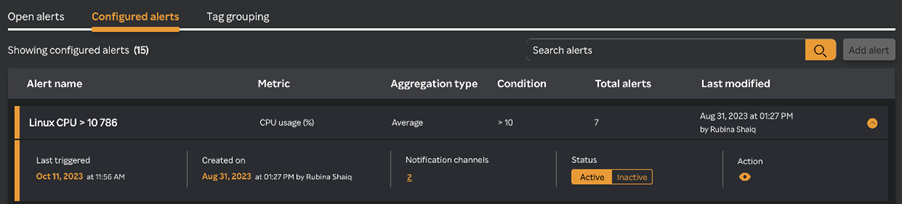
- Click the view icon against the alert. View the alert configuration details.
Multi-column Filter
- Multi-column filter can be applied on numeric columns within the Configured Alerts Table to refine the displayed data based on specific conditions.
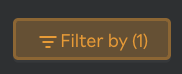
- When the user clicks on the “Filter by” option, user can apply filter below numeric columns
| Field | Description |
|---|---|
| Condition | Defines the criteria or rule that triggers the alert. |
| Total alerts | Total number of alerts generated based on the configured condition. |
| Last modified | Timestamp indicating when the alert configuration was last updated. |
- Each filter condition is applied using the below operators and value ( user input based on the unit)
| Operator |
|---|
| Greater than |
| Less than |
| Equals |
| Greater than or equals |
| Less than or equals |
| contains ( can be applied only for condition column) |
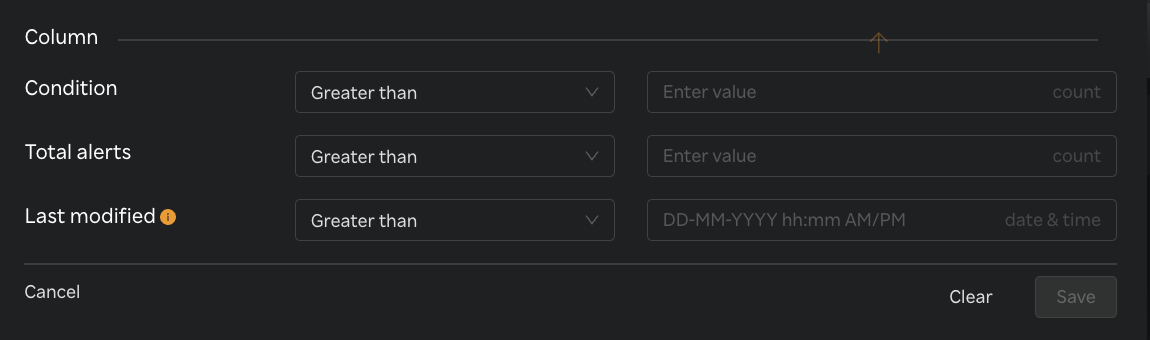
- Once filters & conditions are applied save button is enabled & click "Save" to apply the filter.
- Once filters & conditions are applied it displays no. of filters are applied.
note
- Filters are applied using AND logic — all specified conditions must be met for a record to be displayed.
- Only numeric columns support filtering; non-numeric fields (e.g., text or categorical values) are excluded from the filter options.
- If no records match the selected filters, the table will display a message such as “No data".
- The multi-column filter state persists until the user clears filters by clicking on "Clear" button when Filter by button is clicked.
- A "Reset" button is available to clear all applied filters and restore the table to its original, unfiltered state. This button is enabled only when one or more filters are currently applied.

To view the group details for alerts, perform the following the procedure.
- Navigate to Alerts > Tag grouping. The following screen appears.
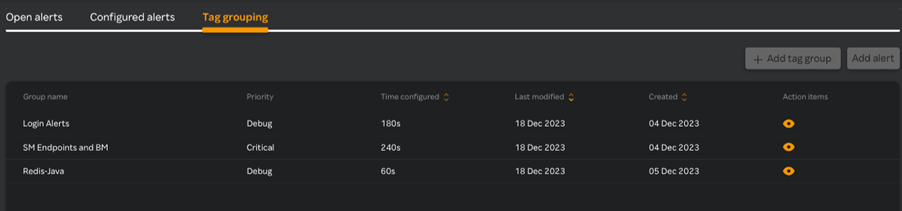
- Click the View
 icon against the alert.
View the alert grouping details.