Lambda dashboard
- Login to the SixthSense portal.
- Click Cloud Monitoring on the left pane.
- Select AWS in the Select cloud drop-down list.
- Select LAMBDA in the Select service drop-down list.
- Select a connection name field is prefilled with the name based on the selected service.
A screen similar to the following appears.

The Overview pane consists of the following cards:
| Metric name | Description |
|---|---|
| Total functions | Total number of Lambda function across all selected subscriptions. |
| Average CPU total time (ms) | Average total CPU time consumed in milliseconds by all Lambda functions across selected subscriptions. |
| Total executions | Total number of executions for all Lambda functions across selected subscriptions. |
| Total errors | Total number of errors encountered across all executions of Lambda functions across selected subscriptions. |
| Average memory usage (%) | Average memory usage for all Lambda functions across selected subscriptions. |
| Average duration (ms) | Average duration for all Lambda functions across selected subscriptions. |
- Select either Top 10 connections by alerts or Top 10 metrics by alerts. These options display the alerts by connections or by metrics. For more information about configuring AWS alerts, see AWS alerts.
note
Top 10 connections by alerts is selected by default.
- Search for a connection name in the Search connection name field.
- Click the Download tab to download the connection detail report in PDF format.
The Subscription overview pane displays either a Table view or Chart view based on your selection. Table view is selected by default. The list of connections along with its details are available in a table format similar to the following screen.
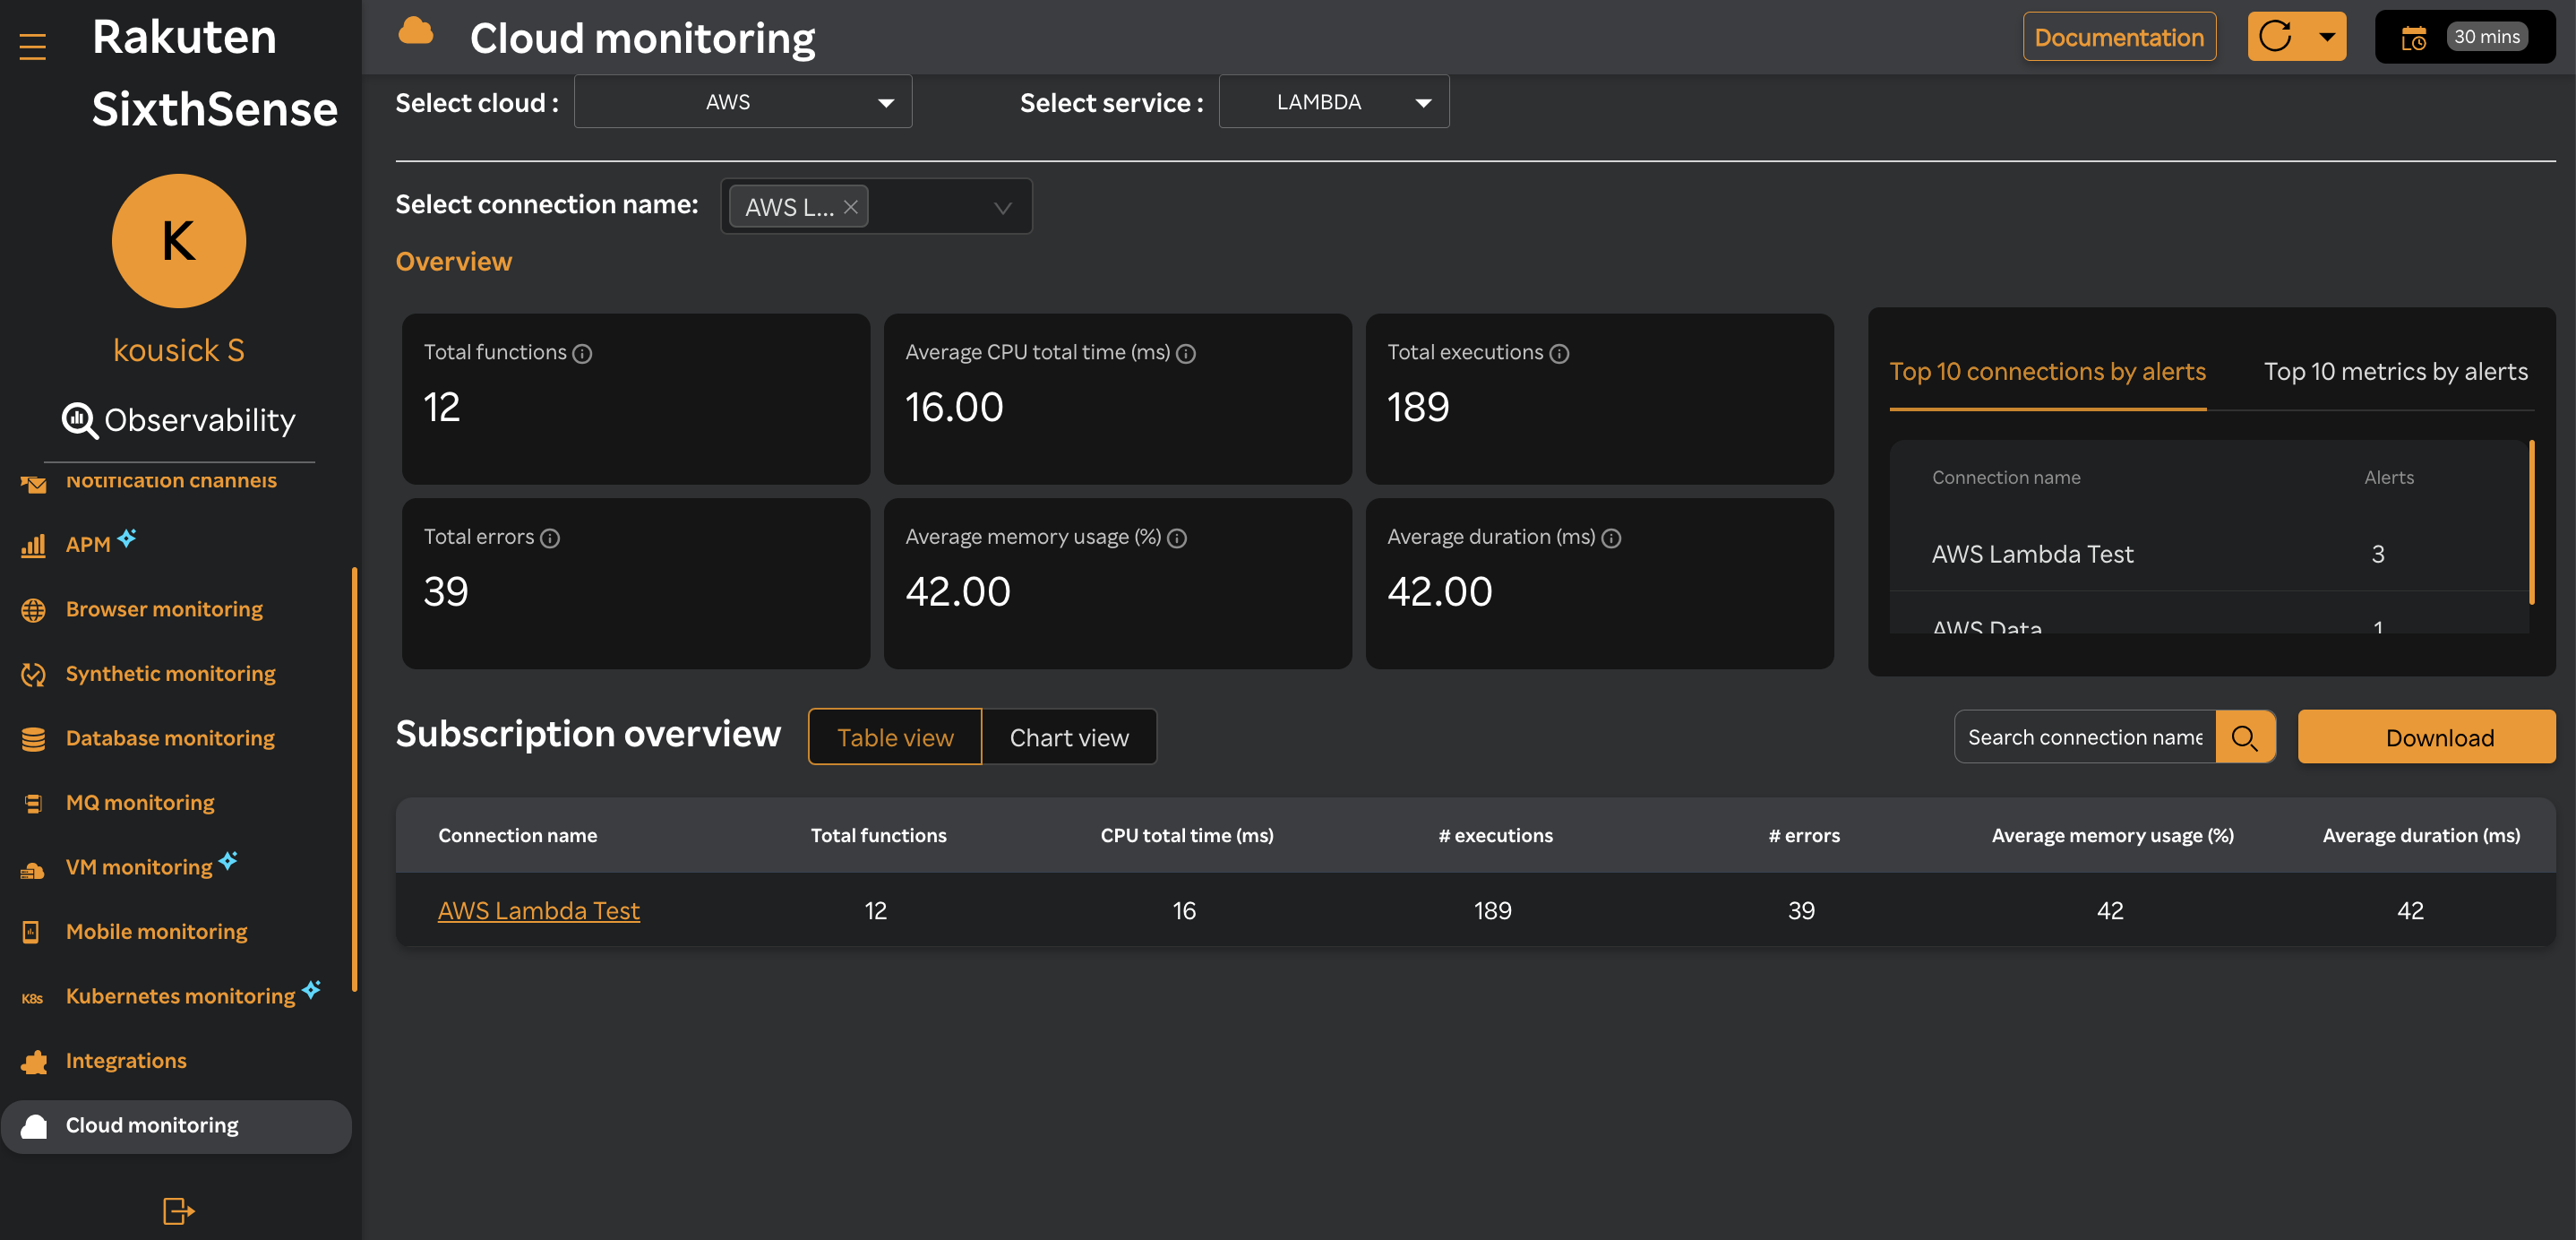
| Column name | Description |
|---|---|
| Connection name | relates to identifiers or labels for connections established by your Lambda function. Clicking the connection name will take you to the All functions pane. |
| Total functions | Number of Lambda functions deployed as part of an application or microservices setup. |
| CPU total time (ms) | refers to the cumulative time spent by a function using CPU resources during execution. |
| # executions | refers to the invocations of a Lambda function. Each time a Lambda function is triggered, an execution occurs, and AWS monitors and tracks these events. |
| # errors | refers to execution failures during the invocation of a Lambda function. |
| Average memory usage % | refers to the average amount of memory consumed by a Lambda function during its execution over a given period in percentage. |
| Average duration (ms) | refers to the average execution time of a Lambda function over a specified period in milliseconds. |
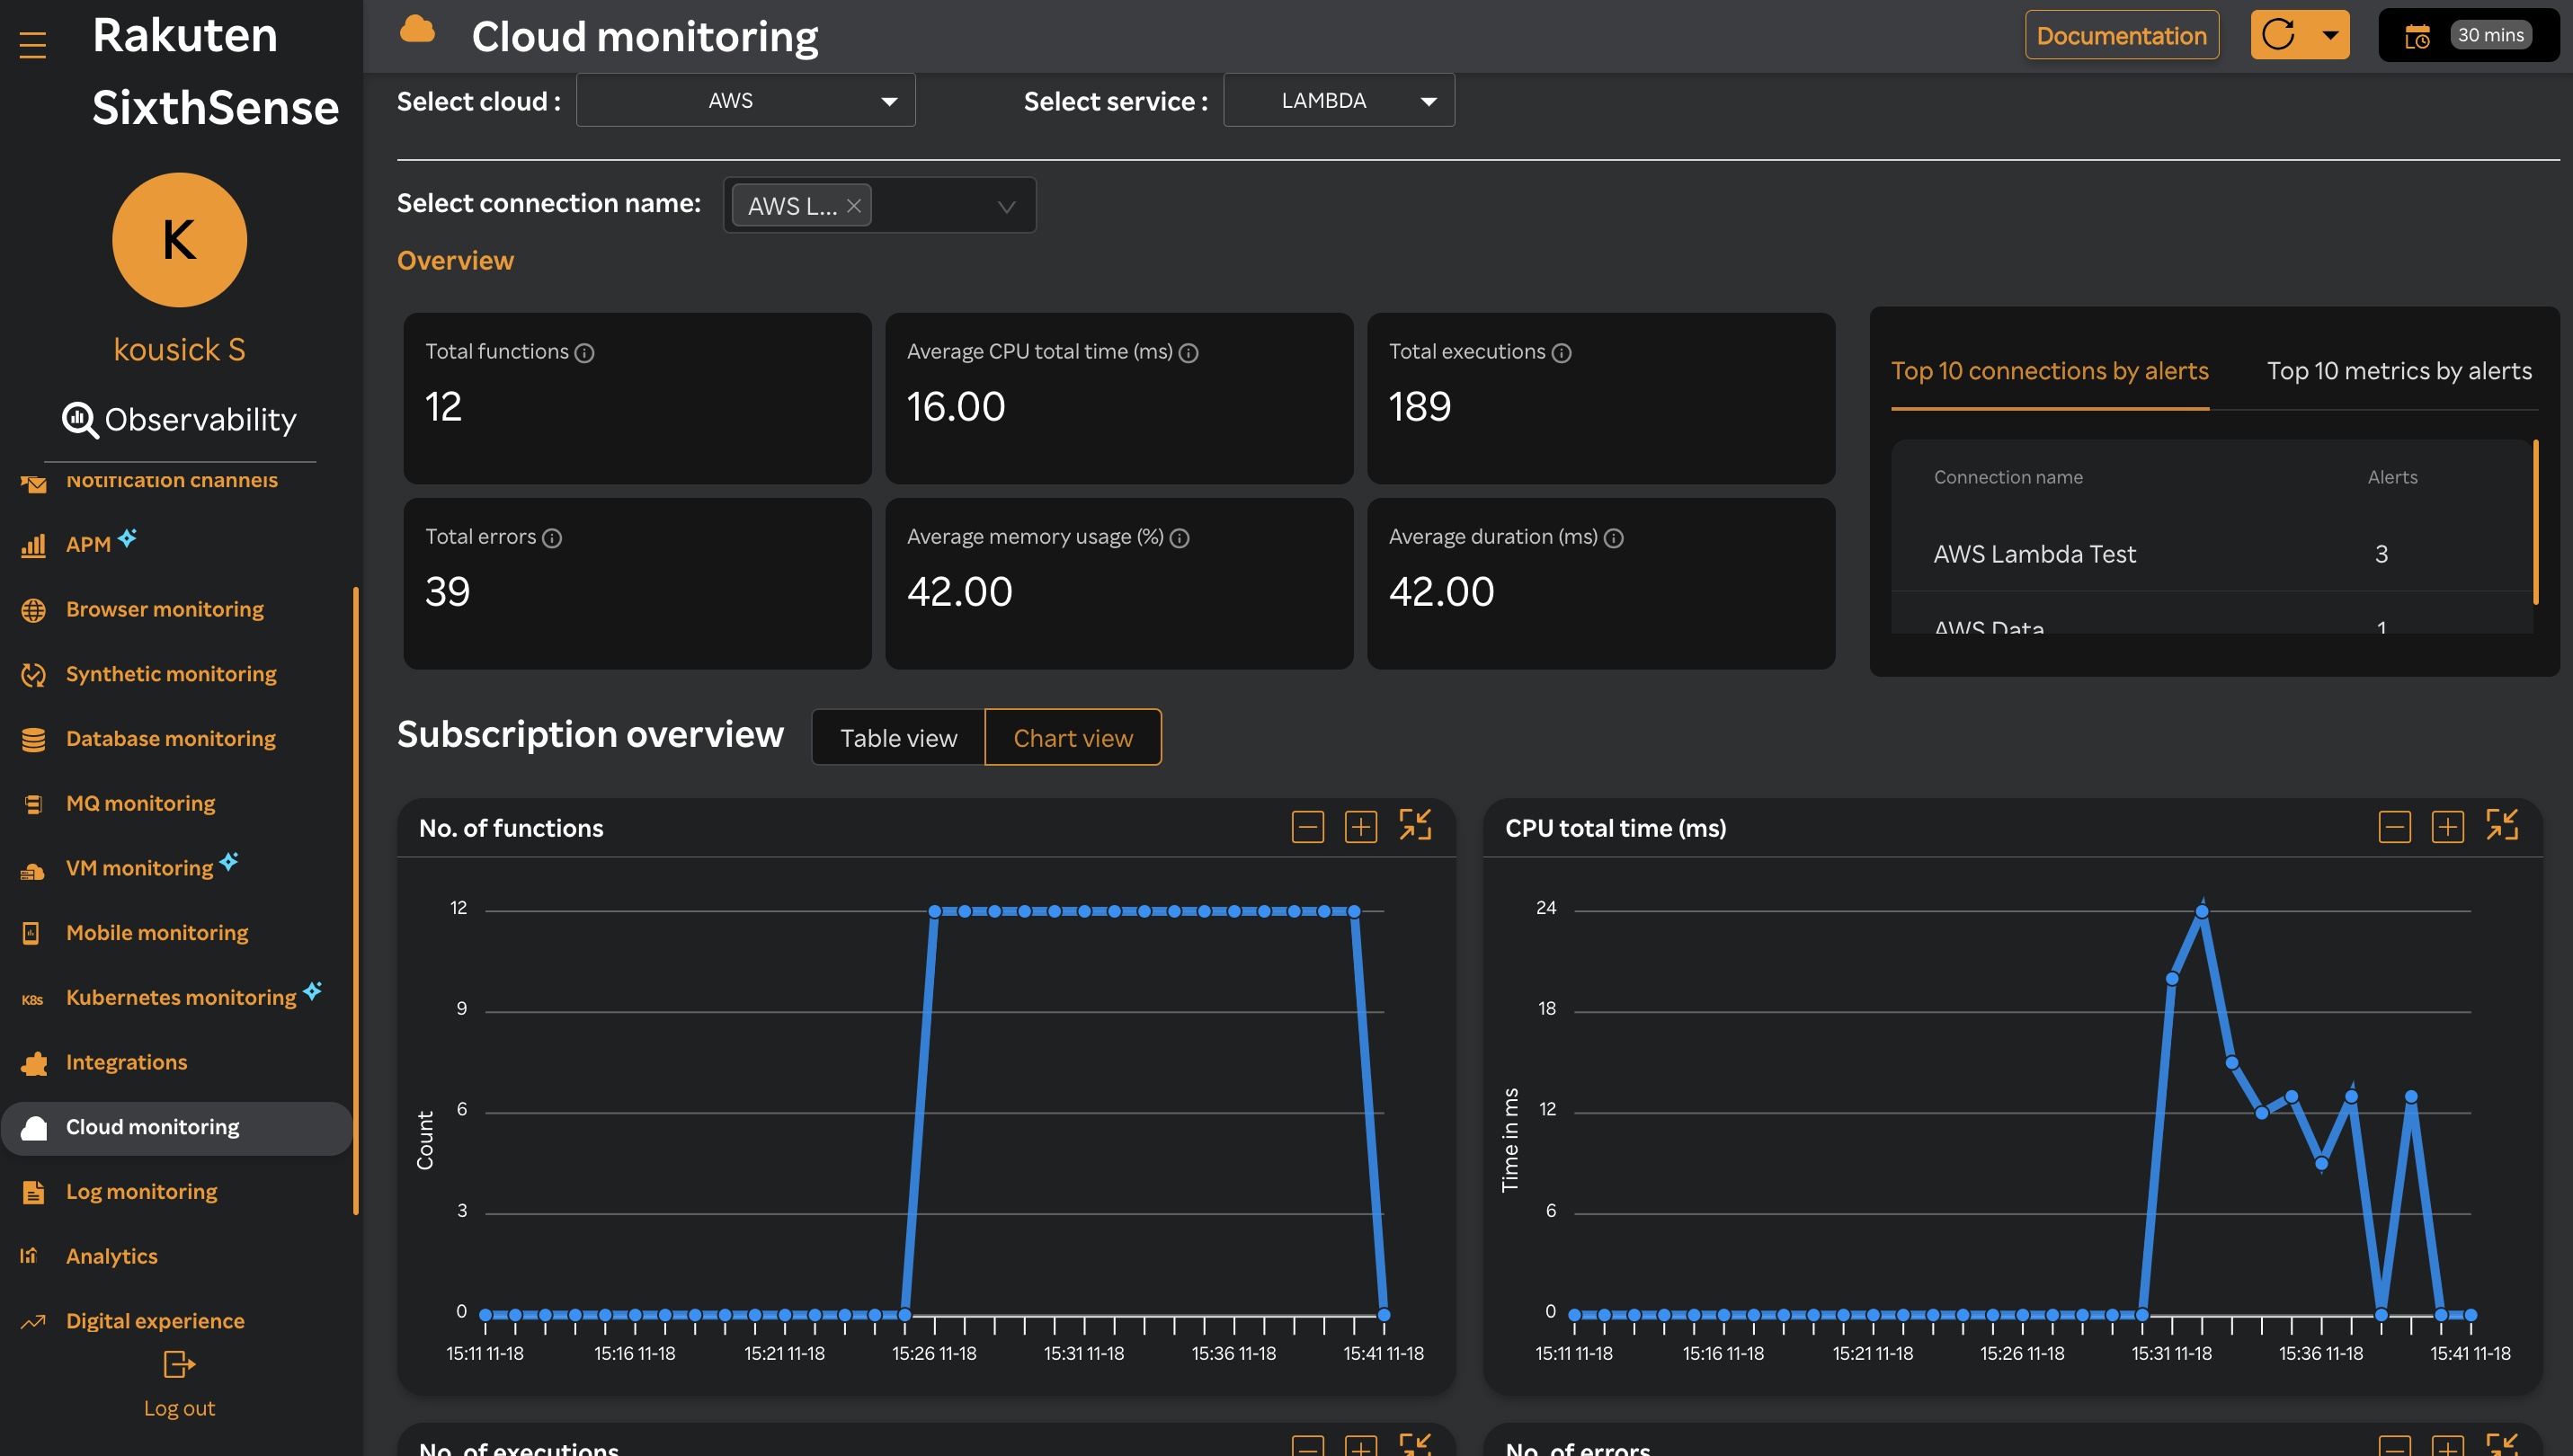
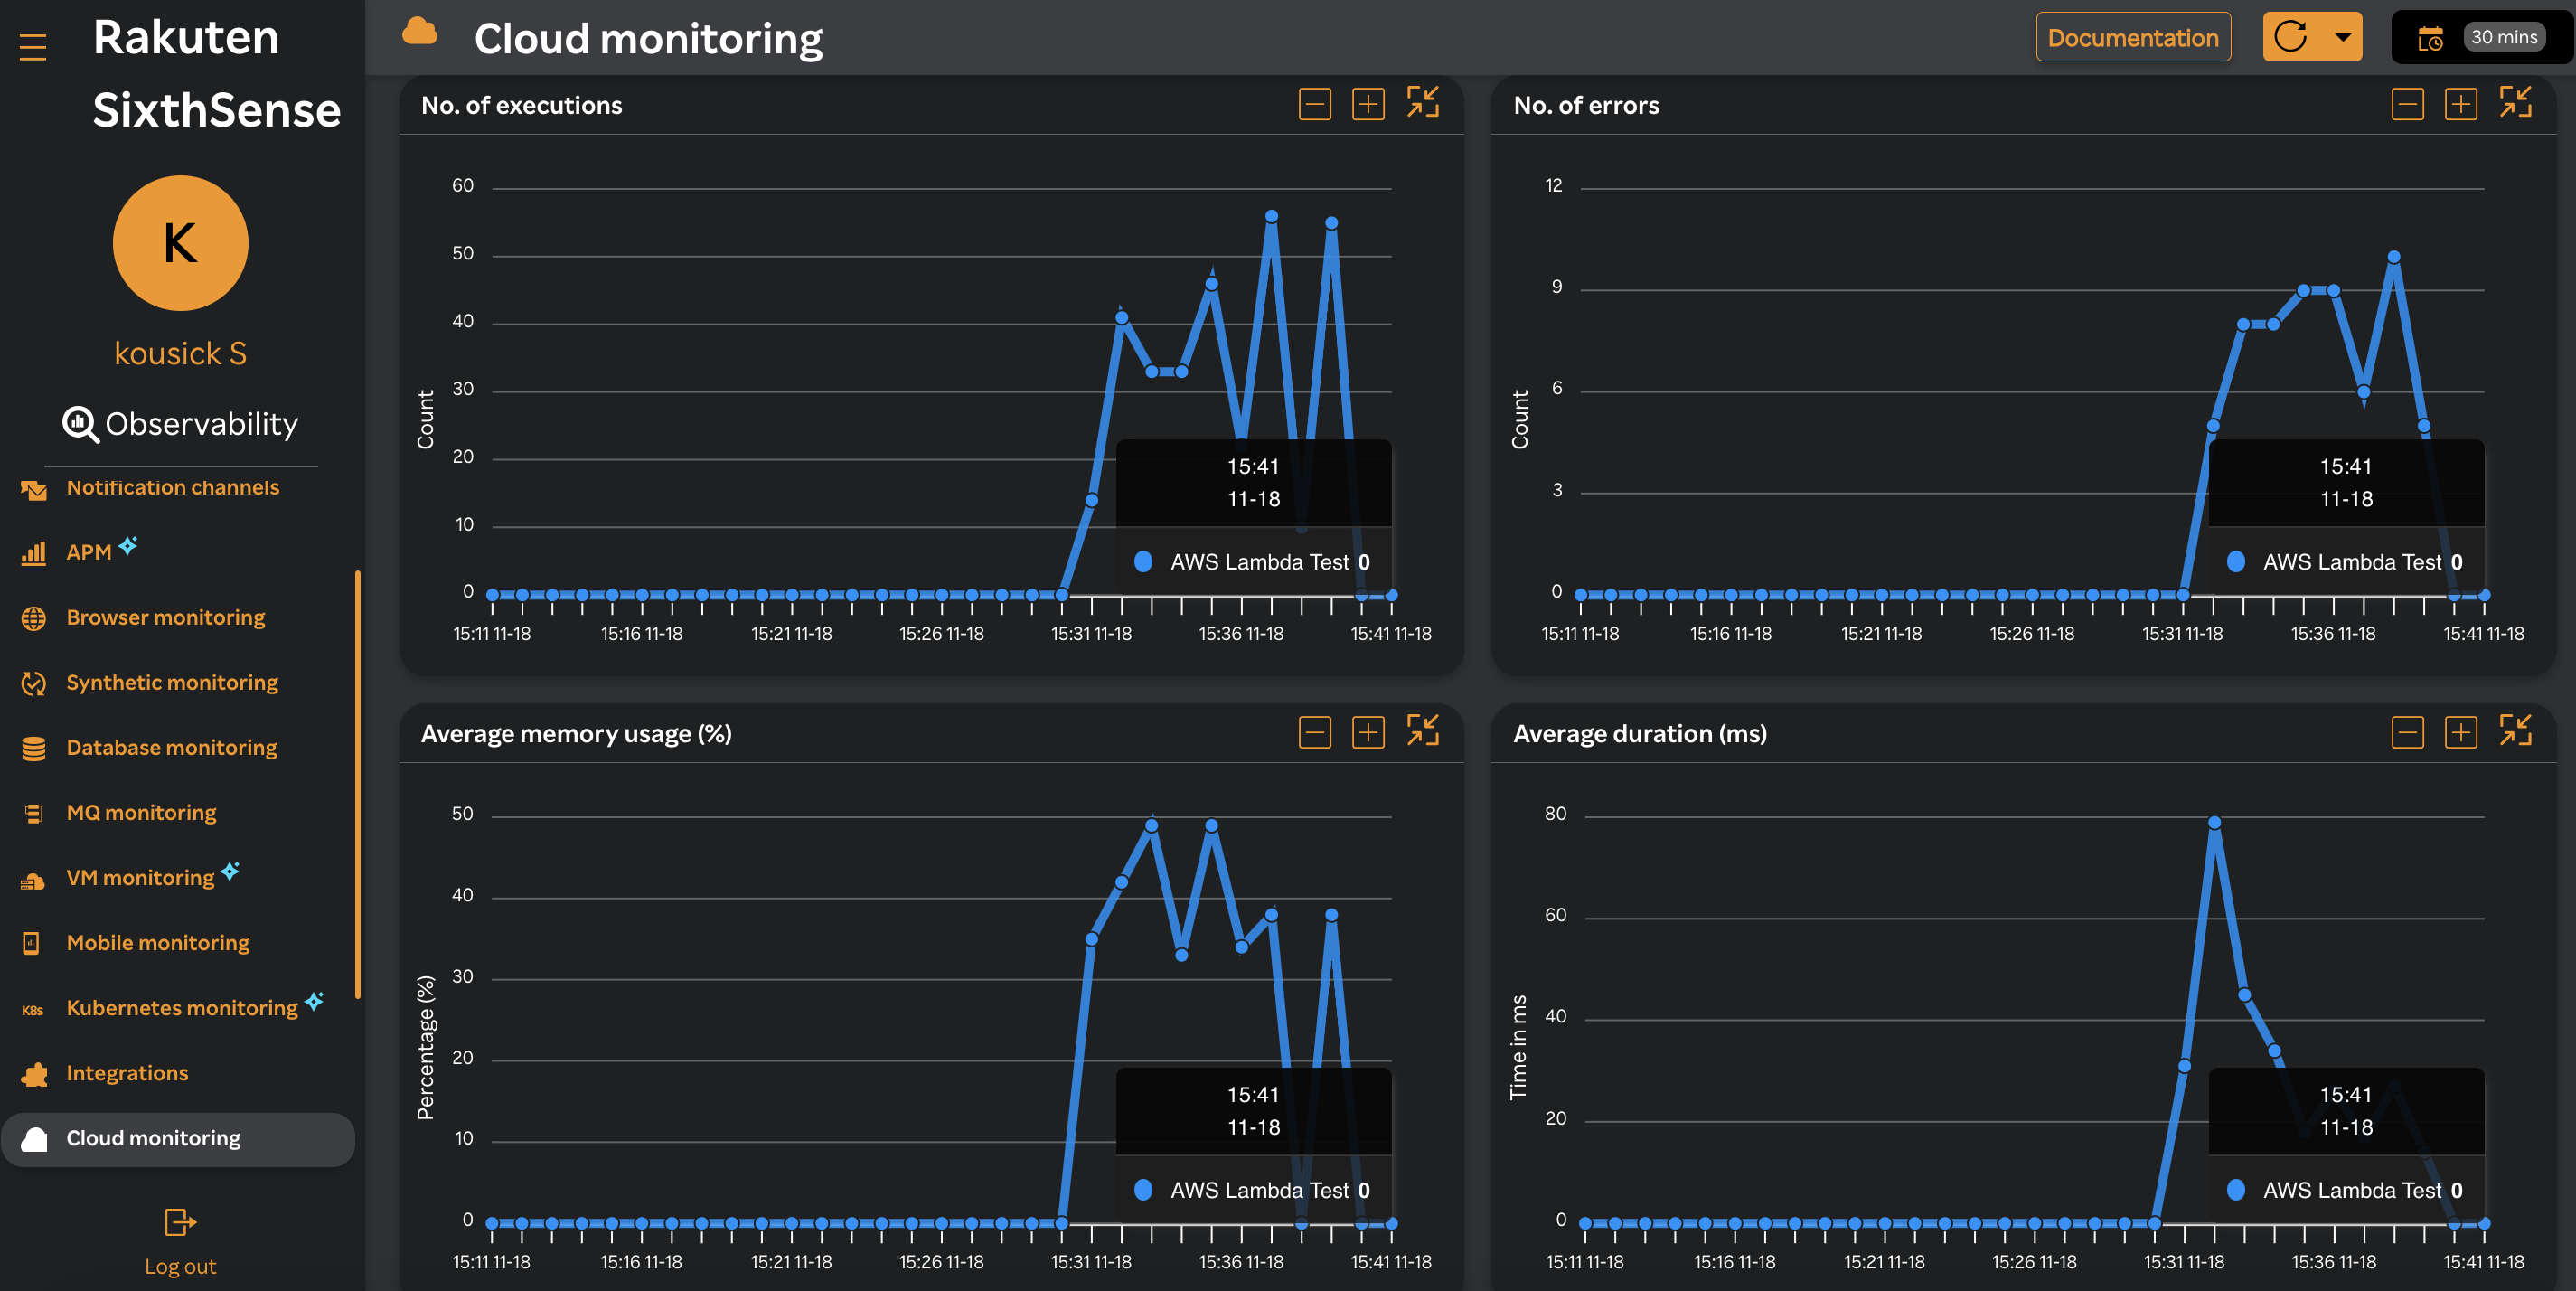
Select Chart view to view the chart view similar to the following screen.
- Click on any connection name listed in the Connection name column under the Subscription overview pane.
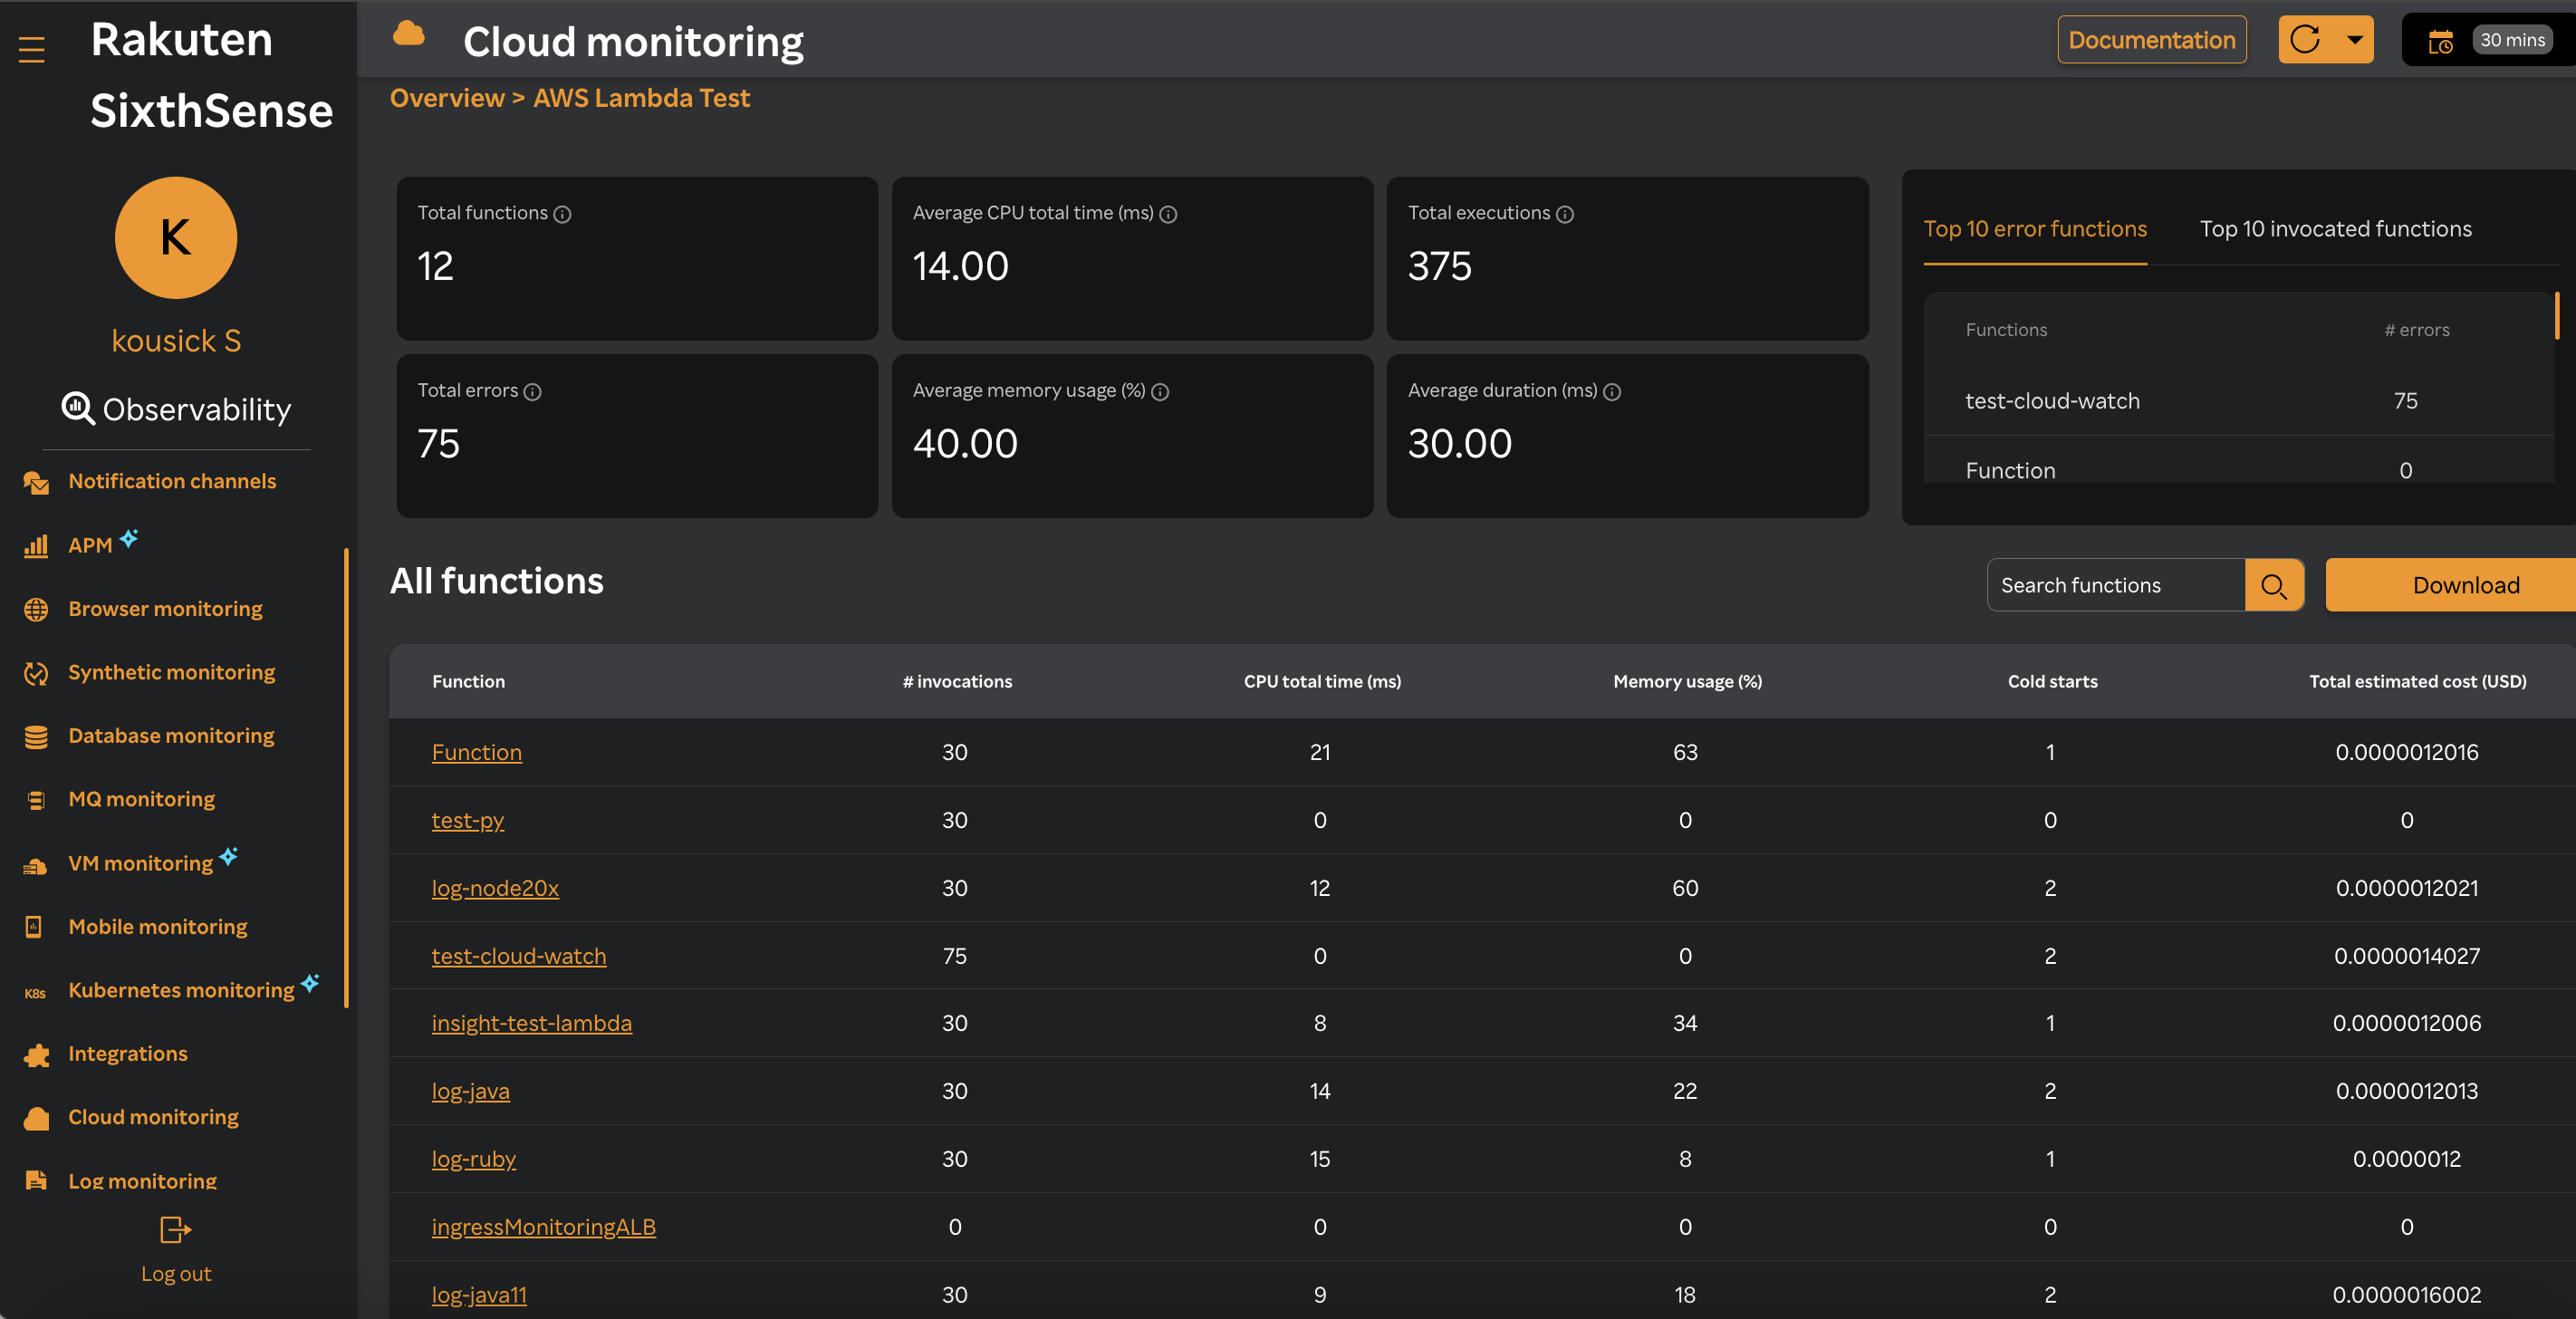
The All functions pane similar to the following appears.
- Search for a function from the Search functions field.
- Click the Download tab downloads the function detail report in PDF format.
The following columns are displayed in a table view.
| Column name | Description |
|---|---|
| Function | it is the primary unit of deployment and execution. |
| Invocations | refers to the process of calling or triggering a Lambda function to execute in response to an event. |
| CPU total time(ms) | refers to the total amount of CPU time consumed by a Lambda function during its execution. |
| Memory usage (%) | refers to the amount of memory that a Lambda function consumes during its execution. |
| Cold starts | refers to the initialization time that occurs when a new instance of a Lambda function is invoked for the first time or after it has been idle for a while. |
| Total estimated cost (USD) | refers to the total amount of money you would spend for executing your Lambda functions based on various usage factors. |
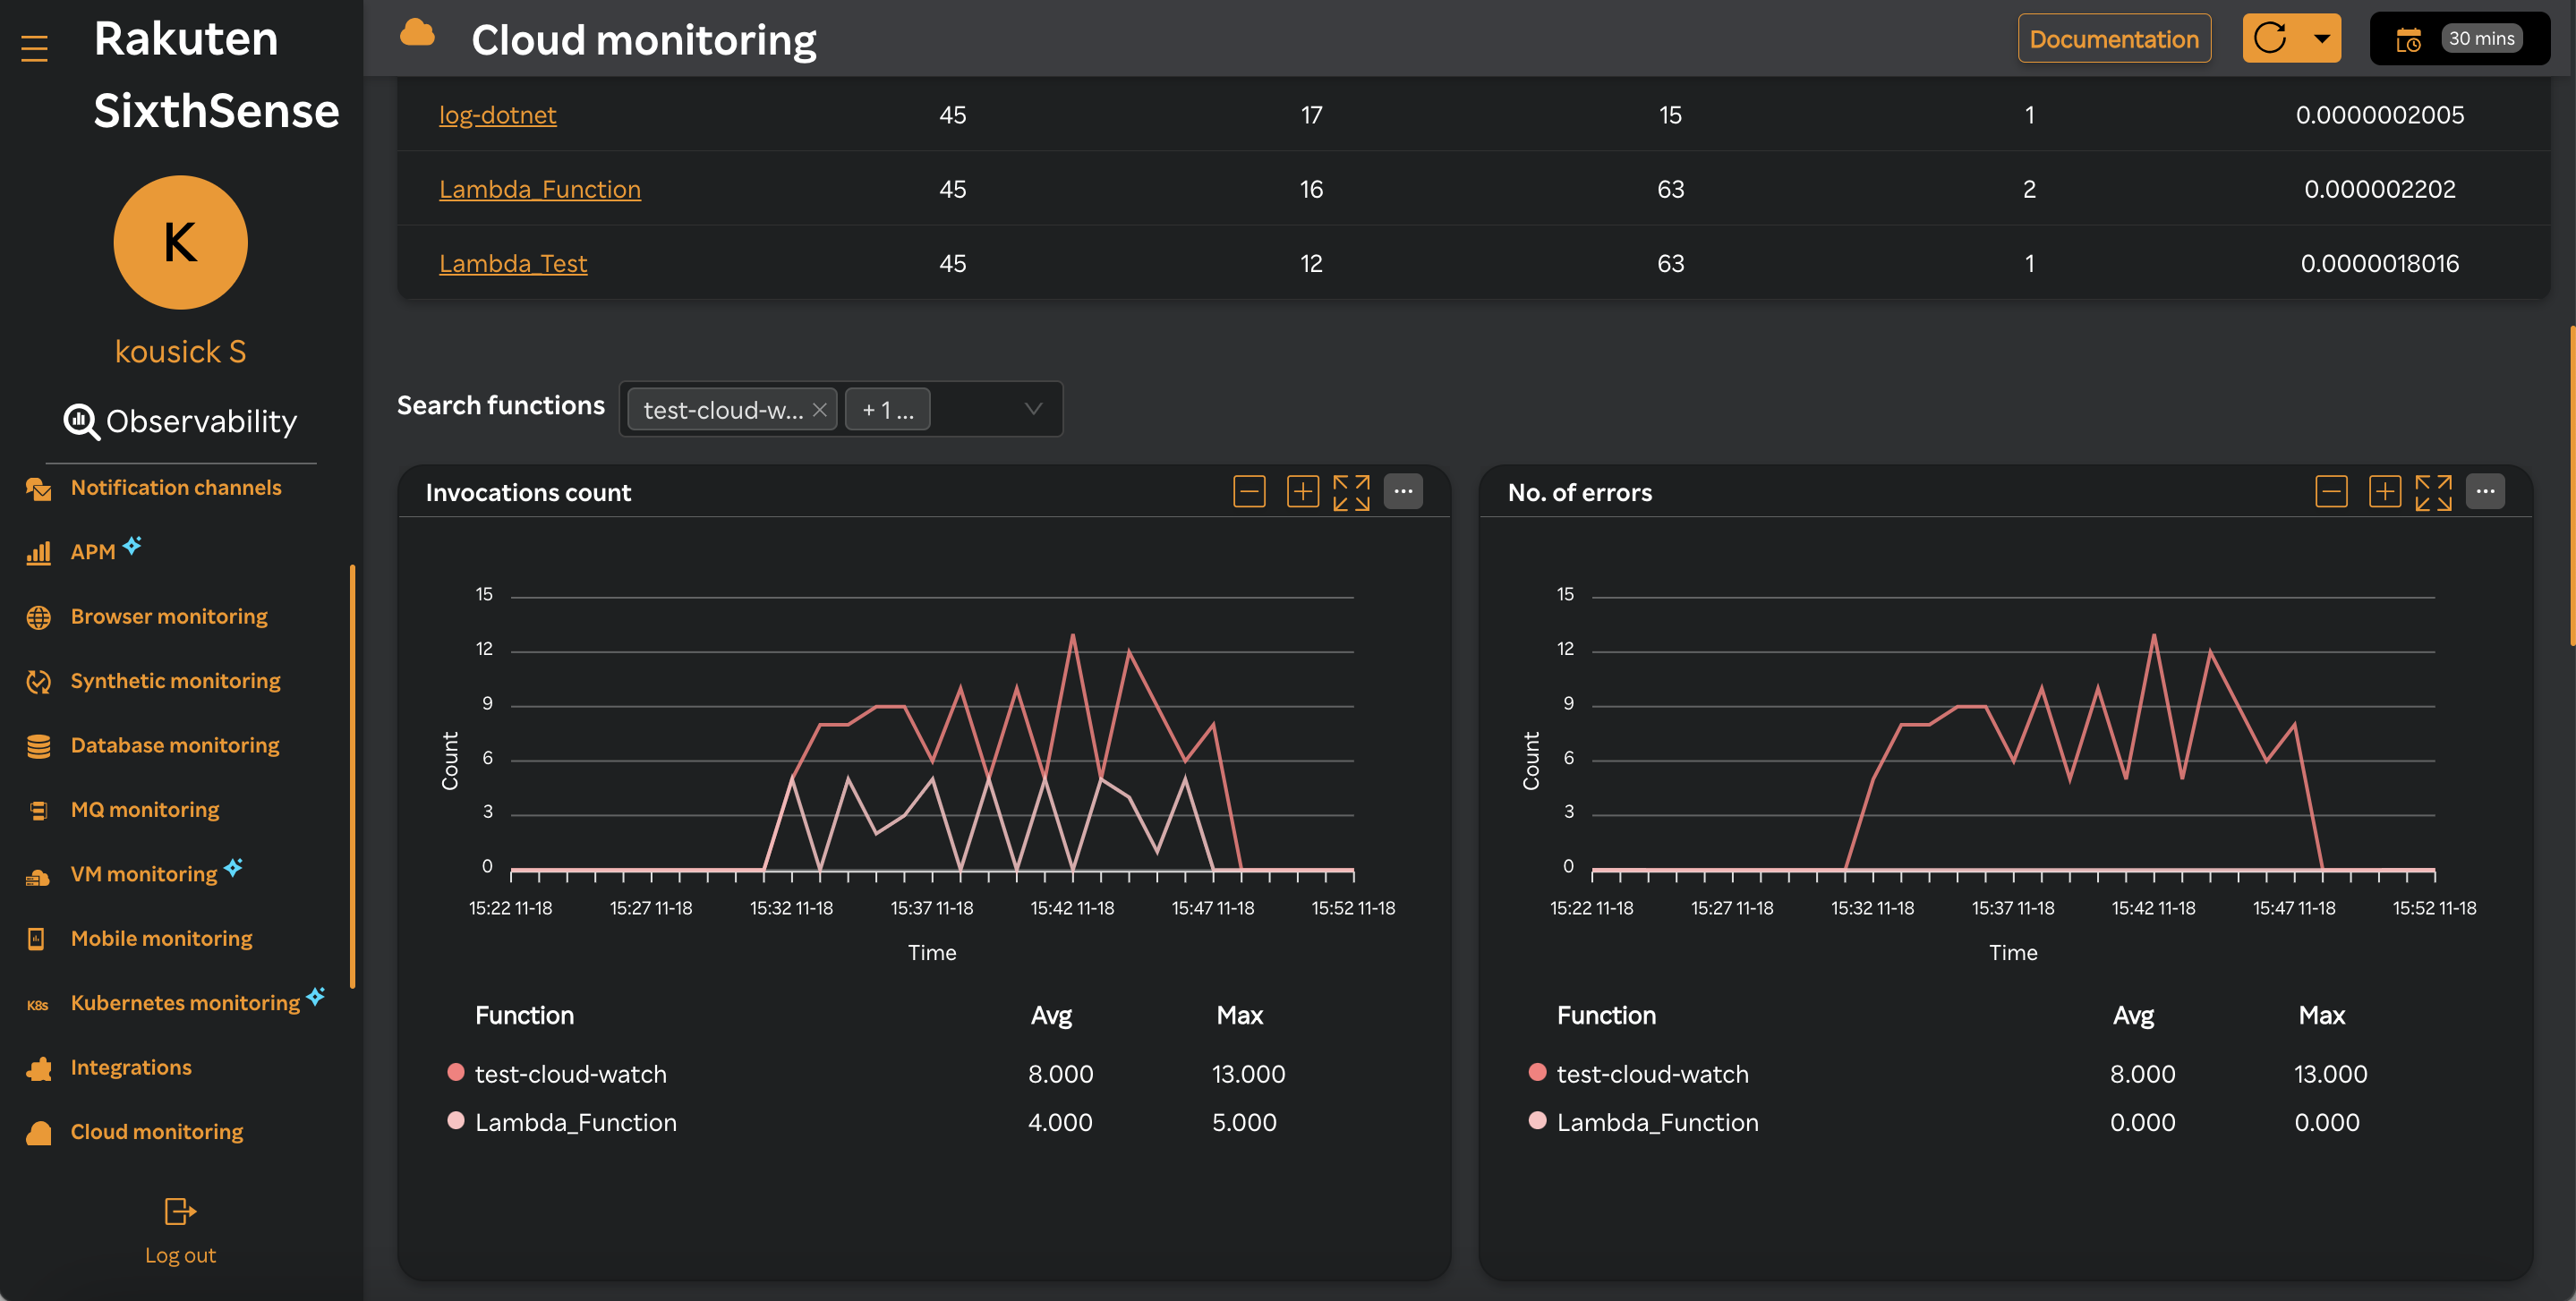
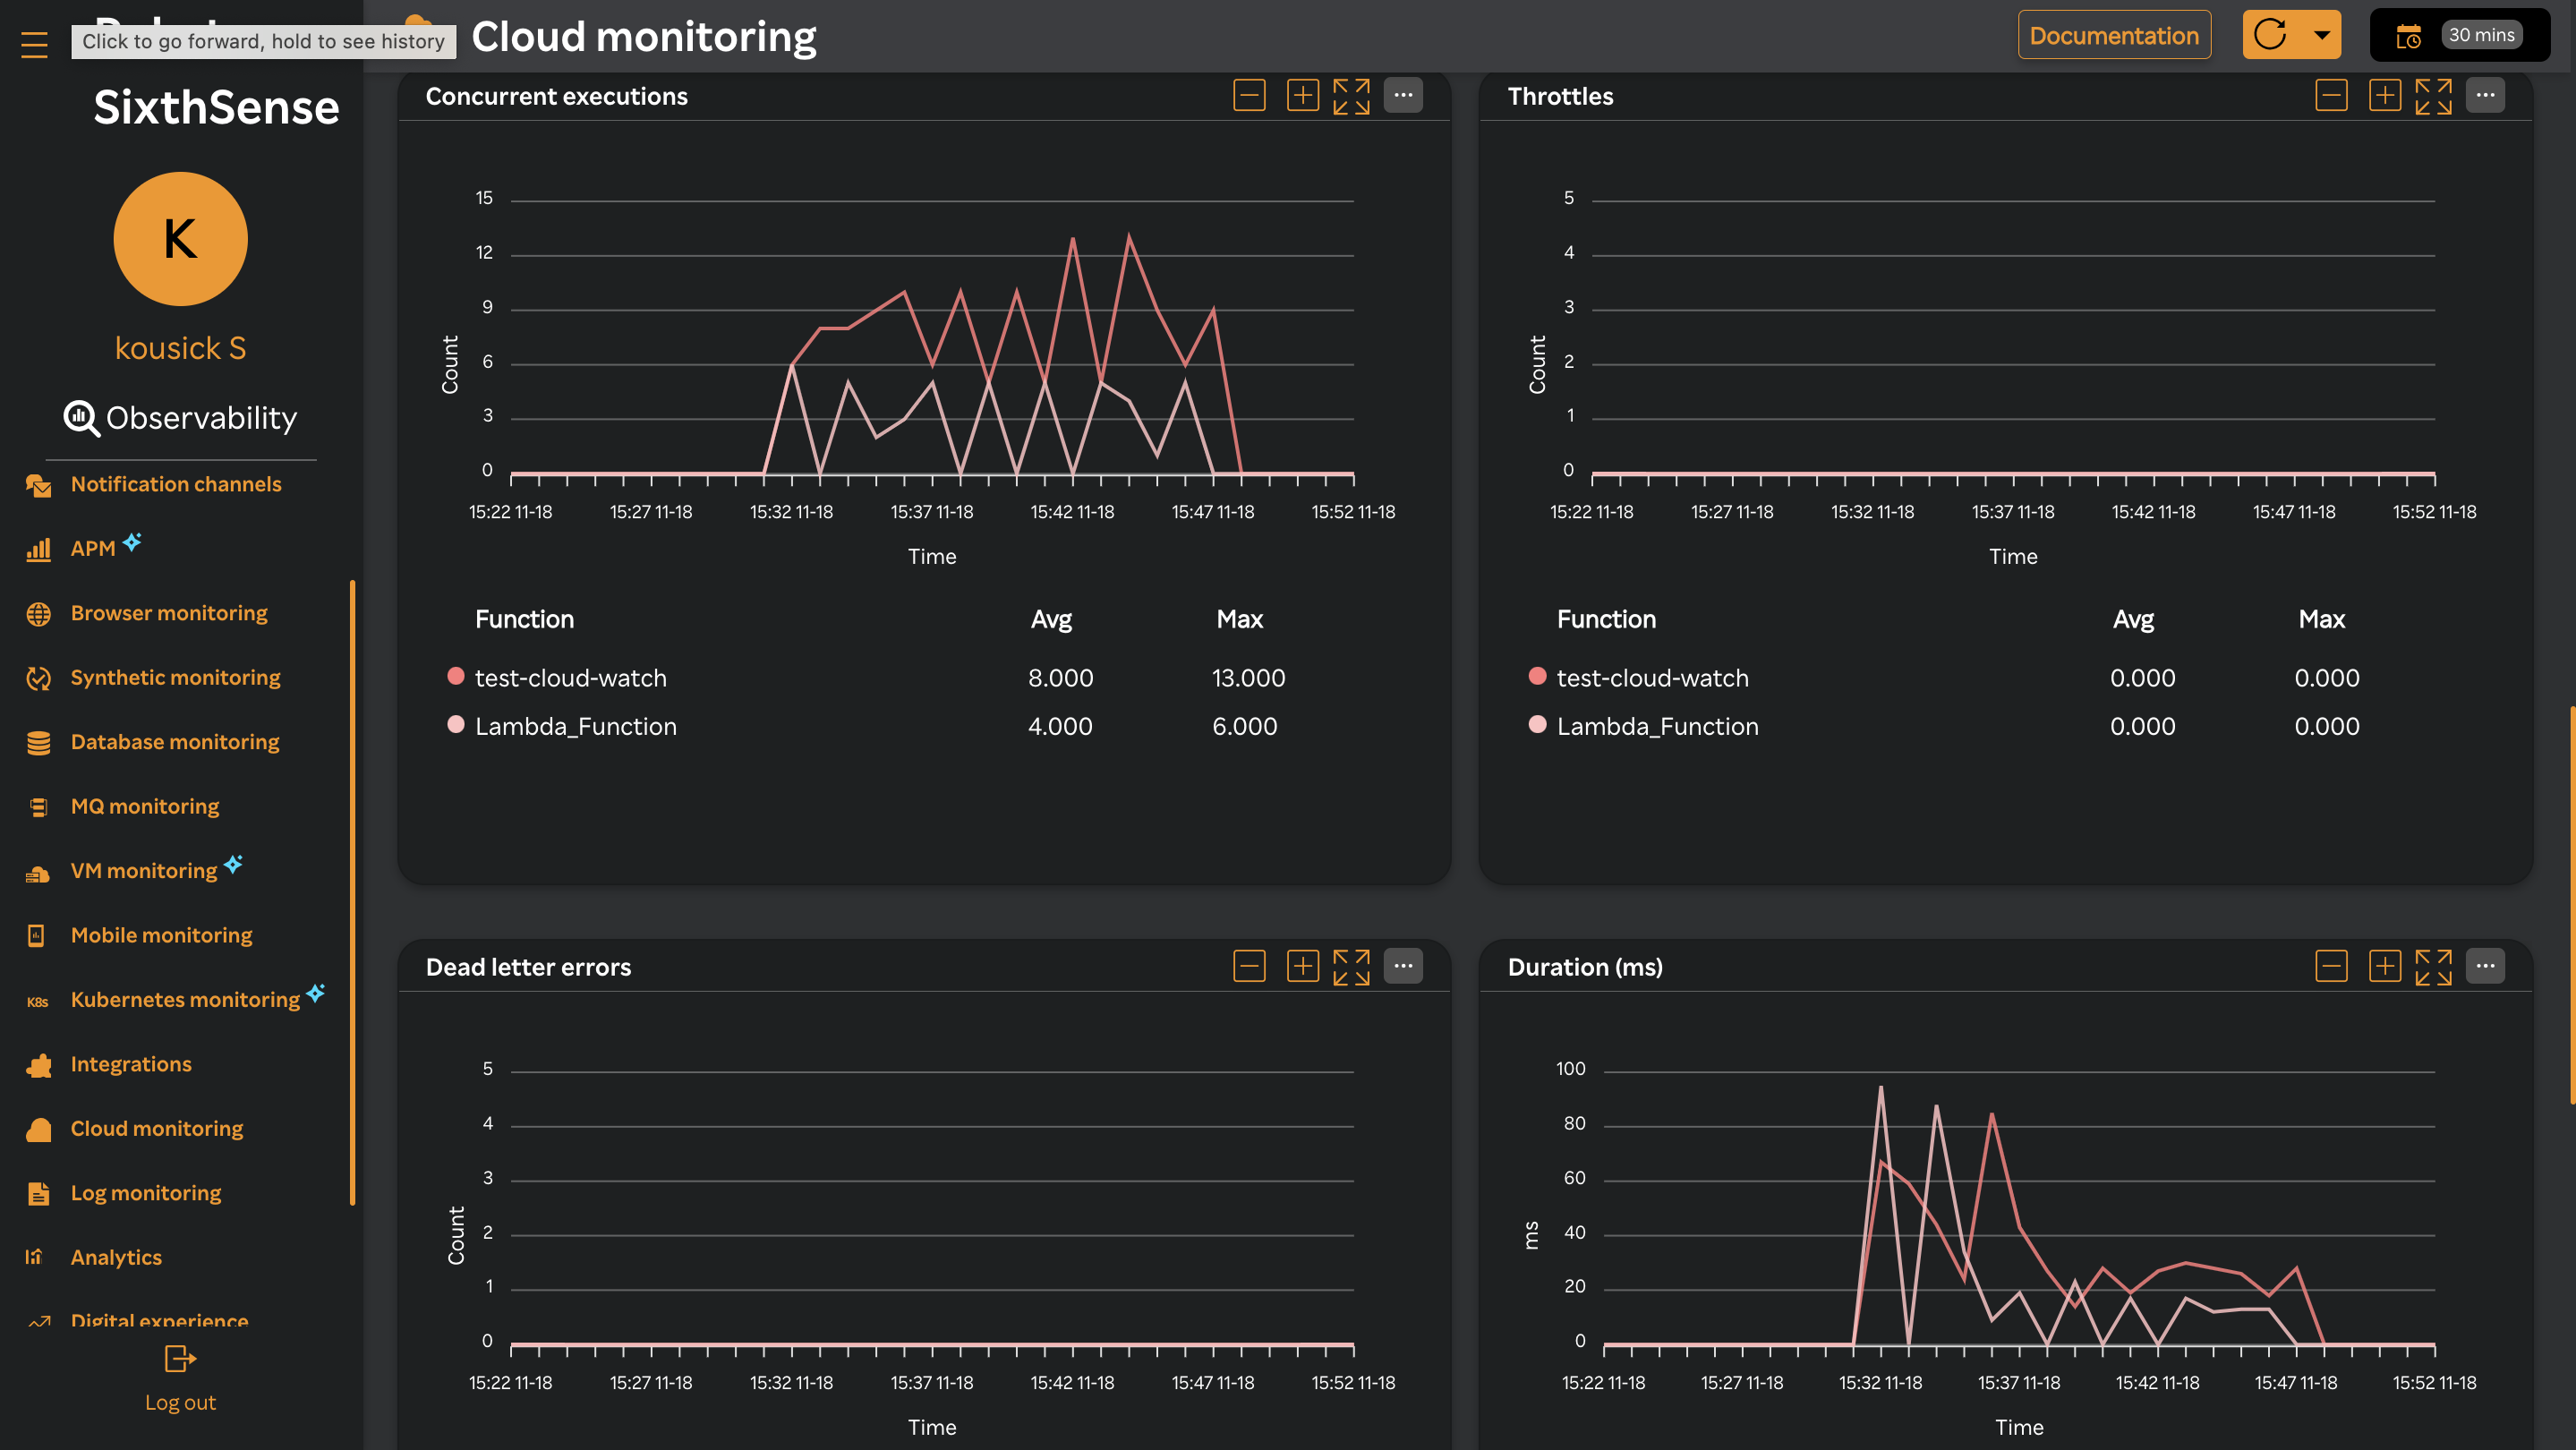
You can also see the function widgets for the metrics below the table similar to the following screens.
| Widget name | Description |
|---|---|
| Invocations count | refers to the number of times triggering of a function by an event or request occurs. |
| No. of errors | refers to the proportion of invocations of a Lambda function that results in an error. |
| Concurrent executions | It refers to the number of instances of a Lambda function that are executing simultaneously at any given time. |
| Throttles | refers to the process of limiting the number of concurrent invocations of a Lambda function to prevent resource exhaustion and maintain stability. |
| Dead letter errors | refers to an error that occurs when a Lambda function fails to process an event successfully and cannot be retried due to the configured retry policy or the event source's limitations. |
| Duration (ms) | refers to the amount of time taken for a Lambda function to execute in response to an invocation. |
| Iteration age | refers to the time elapsed since an event was first placed into an event source. |
| Estimated cost | refers to AWS Lambda charges. |
- Click on any function that is listed in the Function column which will take you to the Invocations page.
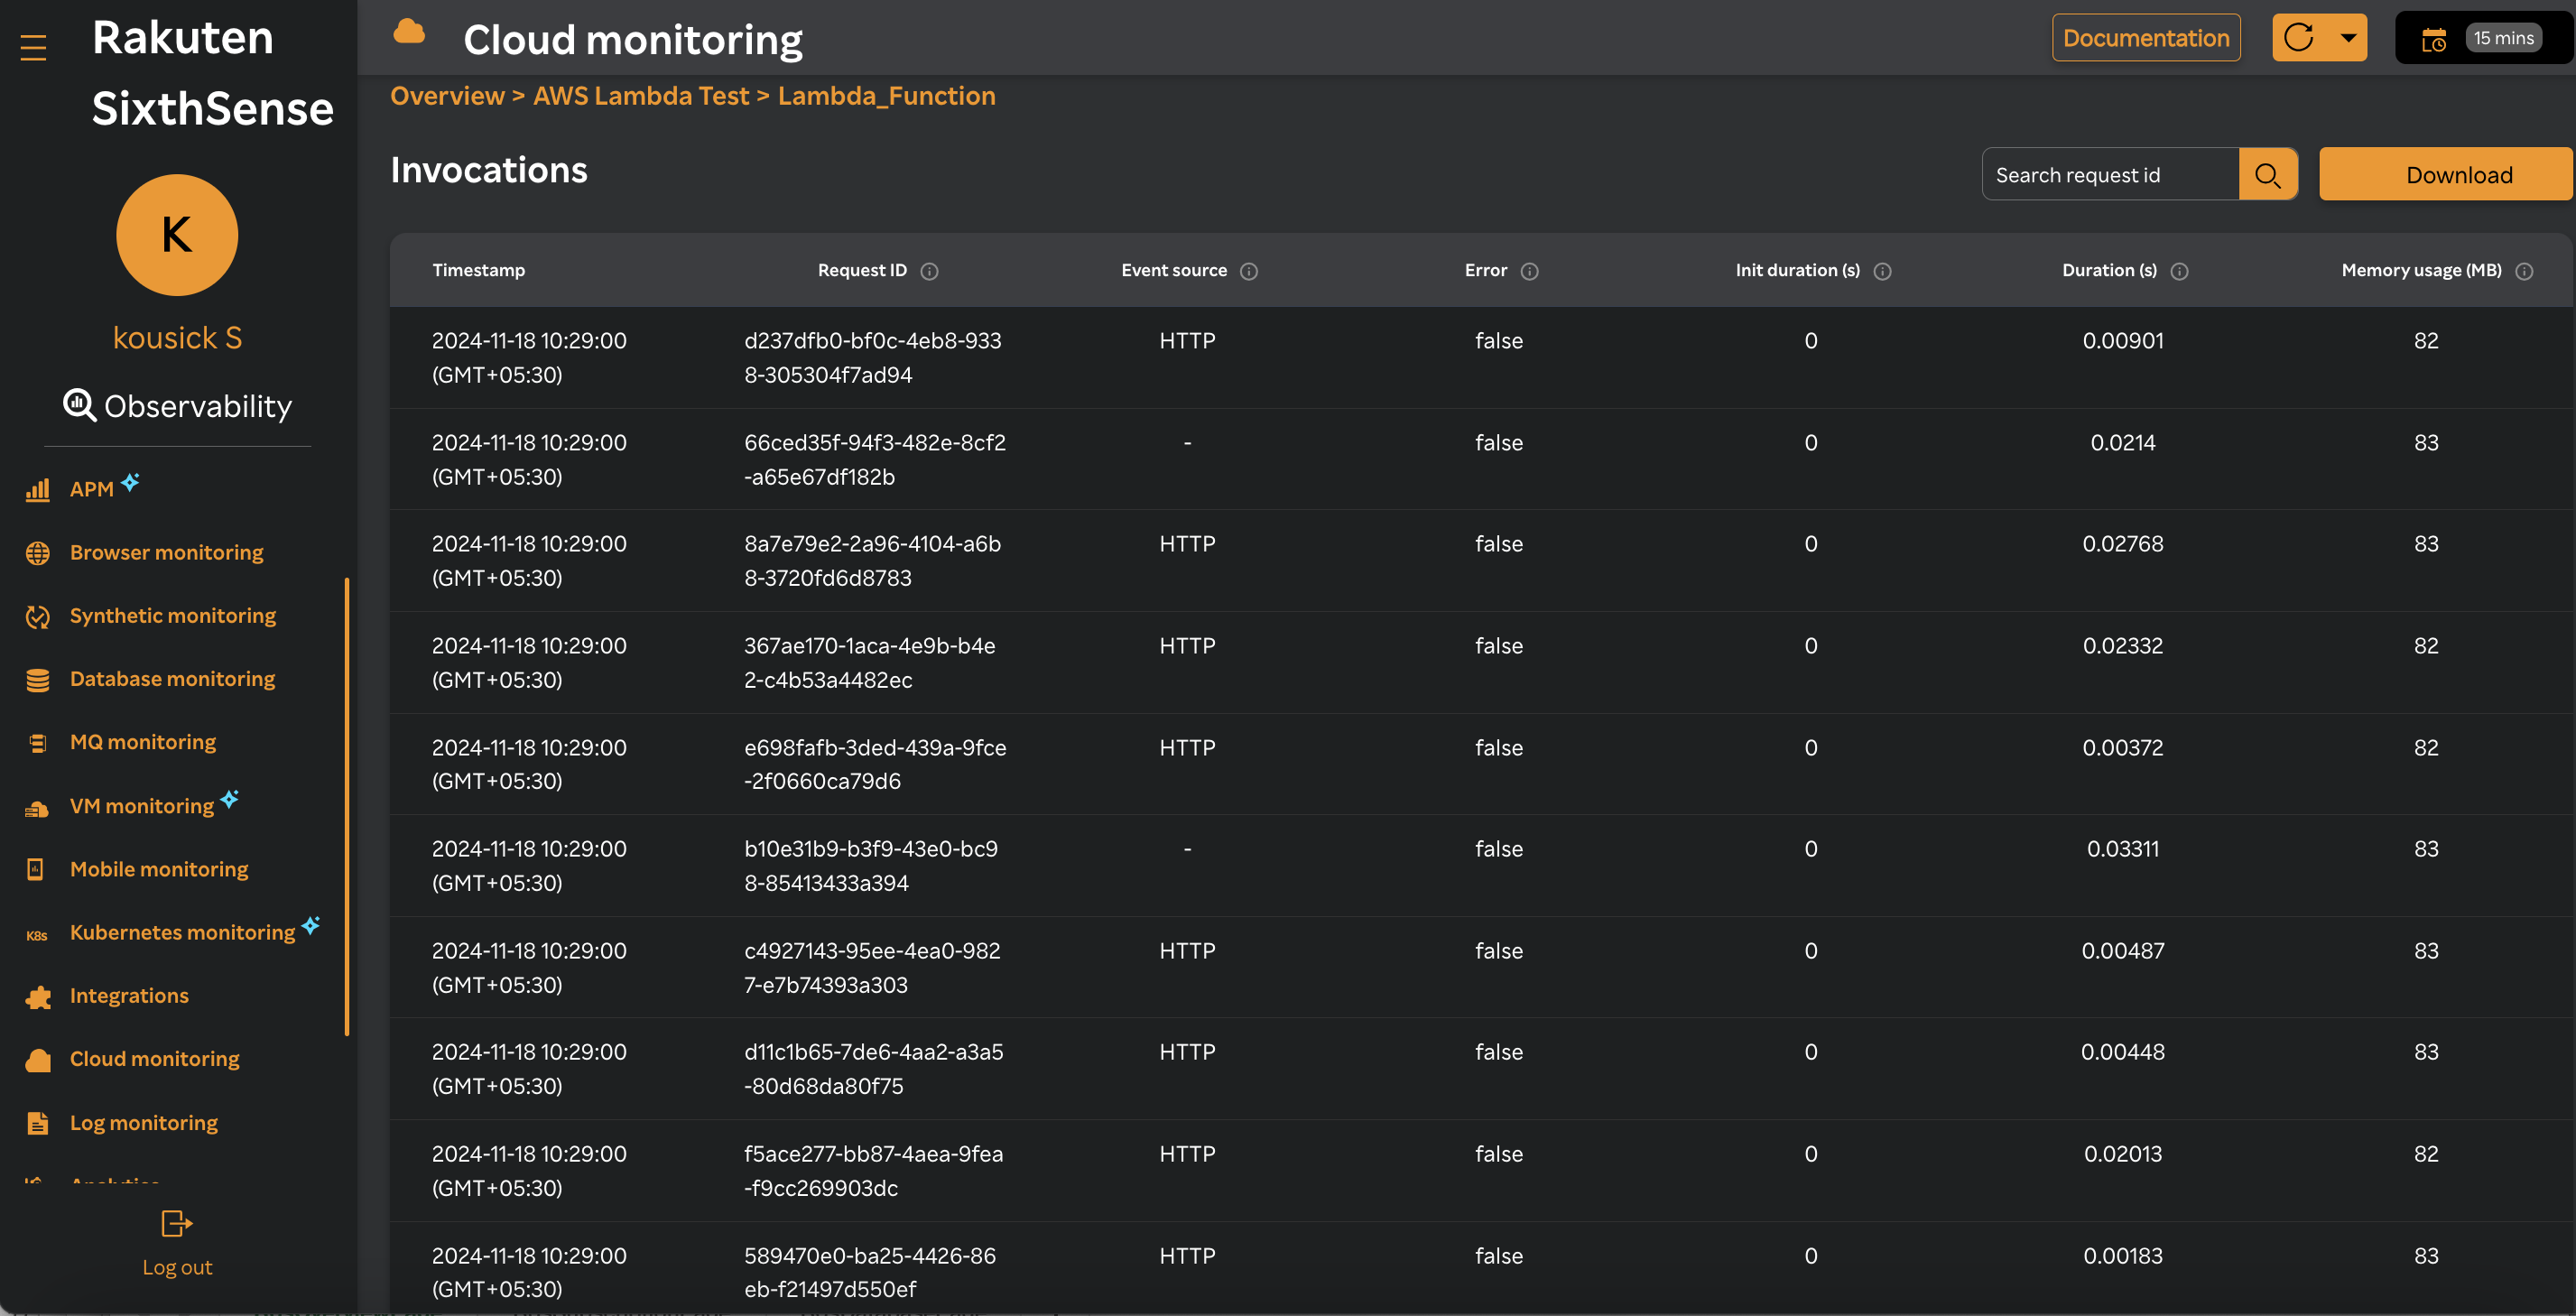
A record of the function is displayed every time you call a function. You can see the table view with the following details.
| Column name | Description |
|---|---|
| Timestamp | The event time stamp. |
| Request ID | Unique identifier for the invocation request. |
| Event source | Origin of the event that triggered the function. |
| Error | Indicates if an error occurred during execution. |
| Init duration (s) | Time taken to initialize the function before execution. |
| Duration | Time taken to execute the function. |
| Memory usage (MB) | Amount of memory consumed during exection. |