Mobile Monitoring Dashboard
The Mobile monitoring dashboard contains the following drop-down fields at the top of the screen.
- Select application: drop-down list allows you to select the mobile application for which you want to view the data.
- Select OS: allows you to filter the view based on the OS. Currently, you can view the applications hosted on iOS and Android.
- Select app version: allows you to filter the information based on the application version. This contains all the applications versions that are in use.
Dashboard
The dashboard tab is a high-level view of your mobile application’s performance. It contains the following four widgets.
- App usage KPIs
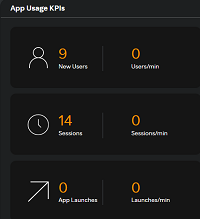
- New users shows the number of new users added during the selected time period.
- Sessions shows the number of active sessions during the selected time period.
- App launches shows the number of app launches during the selected time period.
- App usage – OS, Versions, and Devices
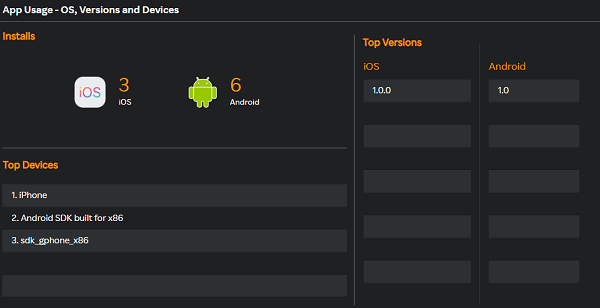
- Installs shows the number of installs on iOS and Android.
- Top devices shows the top five device names on which the application is installed.
- Top versions shows all the versions based on installs.
- Crash KPIs
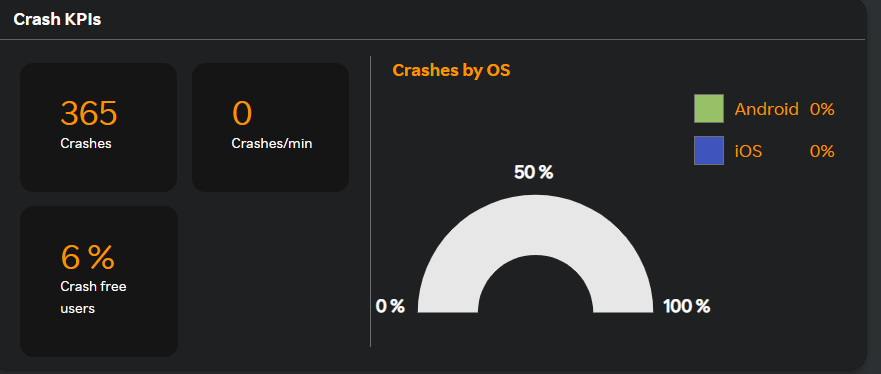
- Crashes shows the number of crashes in the selected timeframe.
- Crash free users % shows the percentage of users that are crash free.
- Crashes/min shows the average of crashes per minute in the selected timeframe.
- Crashes by OS shows the crash percentage by OS.
- Performance KPIs
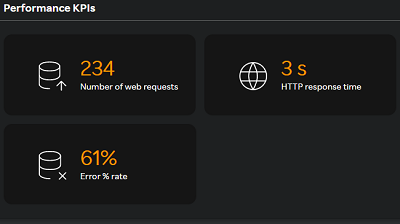
- Number of web requests shows the number of web requests.
- HTTP response time shows the average HTTP response time
- Error % rate shows the percentage of error-free users.
KPIs
The KPIs tab contains the following three sub-tabs.
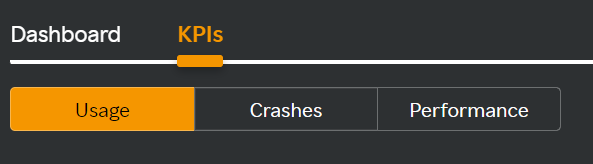
Usage
Usage metrics contains the following graphs.
- Active Sessions
- App launches
- New users
- App version distribution
- Usage by OS
- Usage by device
Crashes
Shows the below graphs related to crashes.
- Crashes
- Crash affected users
- Crashes by OS
- Crashes by app version
- Crashes by device (top 5)
Crashes give full visibility of crashes that occurred.
- Click any crash to view all events that occurred for that particular crash.
- Click any Crash ID to view details about the RCA of the crash.
- Geographic Distribution shows how the crashes are distributed across countries.
- Top Locations shows the locations with most number of crashes. Click any country to view the country-specific crash data.
Downloading reports
Click the  icon to download reports by navigating to KPIs > Crashes. The crash information table is dowloaded in a PDF format.
Click the View events icon under the Crash events column and click the icon in the Crash Events page to view the crash table in a PDF format.
Click an individual Crash ID in the Crash Events page and click the icon to download the crash event information in a PDF format.
note
Only the top 100 entries are downloaded if there are more than 100 entries for downloading.
Multi-column Filter
Crash Information
- Multi-column filter can be applied on numeric columns within the Crash Information Table ( Mobile monitoring --> KPI --> Crashes --> Crash information --> View all ) to refine the displayed data based on specific conditions.
- When the user clicks on the “Filter by” option, user can apply filter below numeric columns
| Column Name | Description |
|---|---|
| Last occurred | Date and time when the crash was last reported. |
| Crash events | Total number of crash events recorded for the selected app or version. |
| No. of affected users | Number of unique users impacted by the crash. |
- Each filter condition is applied using the below operators and value ( user input based on the unit)
| Operator |
|---|
| Greater than |
| Less than |
| Equals |
| Greater than or equals |
| Less than or equals |
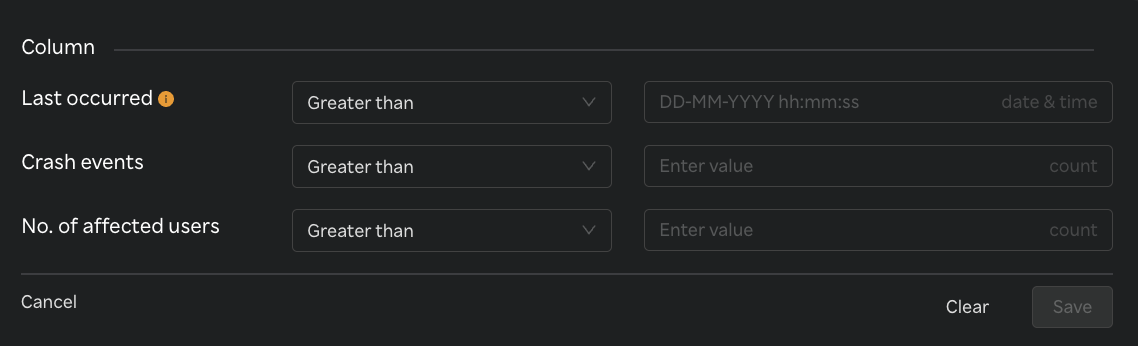
- Once filters & conditions are applied save button is enabled & click "Save" to apply the filter.
- Once filters & conditions are applied it displays no. of filters are applied.
note
- Filters are applied using AND logic — all specified conditions must be met for a record to be displayed.
- Only numeric columns support filtering; non-numeric fields (e.g., text or categorical values) are excluded from the filter options.
- If no records match the selected filters, the table will display a message such as “No data".
- The multi-column filter state persists until the user clears filters by clicking on "Clear" button when Filter by button is clicked.
- A "Reset" button is available to clear all applied filters and restore the table to its original, unfiltered state. This button is enabled only when one or more filters are currently applied.

Crash Events
- Multi-column filter can be applied on numeric columns within the Crash Events Table ( Mobile monitoring --> KPI --> Crashes --> Crash information --> View all --> Crash events column --> View events ) to refine the displayed data based on specific conditions.
- When the user clicks on the “Filter by” option, user can apply filter below numeric columns
| Column Name | Description |
|---|---|
| OS version | Operating system version on which the crash occurred. |
| Date & Time | Date and time when the crash event was recorded. |
- Each filter condition is applied using the below operators and value ( user input based on the unit)
| Operator |
|---|
| Greater than |
| Less than |
| Equals |
| Greater than or equals |
| Less than or equals |
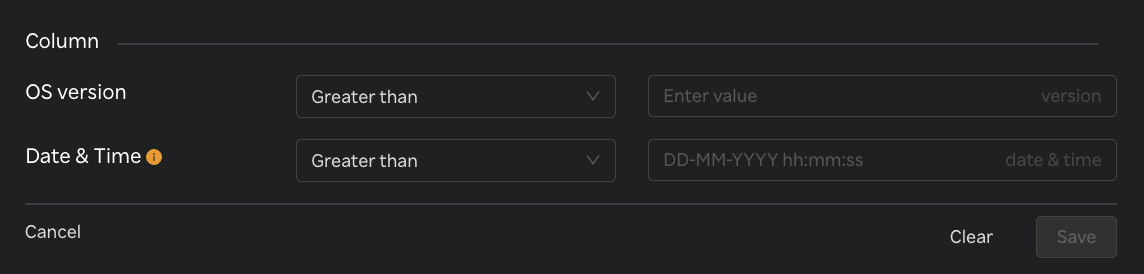
- Once filters & conditions are applied save button is enabled & click "Save" to apply the filter.
- Once filters & conditions are applied it displays no. of filters are applied.
note
- Filters are applied using AND logic — all specified conditions must be met for a record to be displayed.
- Only numeric columns support filtering; non-numeric fields (e.g., text or categorical values) are excluded from the filter options.
- If no records match the selected filters, the table will display a message such as “No data".
- The multi-column filter state persists until the user clears filters by clicking on "Clear" button when Filter by button is clicked.
- A "Reset" button is available to clear all applied filters and restore the table to its original, unfiltered state. This button is enabled only when one or more filters are currently applied.
Crash Top Locations
- Multi-column filter can be applied on numeric columns within the Top Locations Table ( Mobile monitoring --> KPI --> Crashes --> Top Locations --> View all ) to refine the displayed data based on specific conditions.
- When the user clicks on the “Filter by” option, user can apply filter below numeric columns
| Column Name | Description |
|---|---|
| No. of crashes | Total number of crashes reported from the specific location. |
| No. of affected users | Number of unique users impacted by crashes in that location. |
- Each filter condition is applied using the below operators and value ( user input based on the unit)
| Operator |
|---|
| Greater than |
| Less than |
| Equals |
| Greater than or equals |
| Less than or equals |
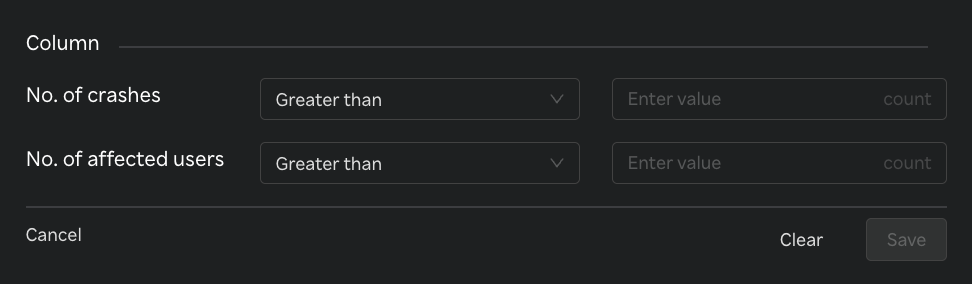
- Once filters & conditions are applied save button is enabled & click "Save" to apply the filter.
- Once filters & conditions are applied it displays no. of filters are applied.
note
- Filters are applied using AND logic — all specified conditions must be met for a record to be displayed.
- Only numeric columns support filtering; non-numeric fields (e.g., text or categorical values) are excluded from the filter options.
- If no records match the selected filters, the table will display a message such as “No data".
- The multi-column filter state persists until the user clears filters by clicking on "Clear" button when Filter by button is clicked.
- A "Reset" button is available to clear all applied filters and restore the table to its original, unfiltered state. This button is enabled only when one or more filters are currently applied.
Performance
The Performance tab displays the information about application performance. The following graphs are available.
You can also view the APM trace details by clicking the APM trace button available on the screen. You can see the correlated mobile data in APM. For more information about APM trace, see APM trace.
Number of requests
HTTP Response time
Error Rate
- Click View Errors to view the full list of errors.
- Click any Error Code to view all error events.
- Click on any event to view details about that error event
Users Impacted by Errors: View the users impacted in this widget.
Top HTTP Requests: View the top HTTP requests that appeared in this widget.
- Click any request name to view more details.
Geographic Distribution displays the country wide details of the number of requests.
Top Locations displays the country-wide details of the applications' performance metrics
- Click any country to view crash information and performance information of the selected country.
Multi-column Filter
Top HTTP requests
- Multi-column filter can be applied on numeric columns within the Top HTTP requests Table ( Mobile monitoring --> KPI --> Performance --> Top HTTP requests --> View all ) to refine the displayed data based on specific conditions.
- When the user clicks on the “Filter by” option, user can apply filter below numeric columns
| Column Name | Description |
|---|---|
| Requests (Reqs/min) | Number of HTTP requests made per minute. |
| Response time | Average time taken to receive a response for the HTTP requests. |
| Error rate (%) | Percentage of HTTP requests that resulted in errors. |
- Each filter condition is applied using the below operators and value ( user input based on the unit)
| Operator |
|---|
| Greater than |
| Less than |
| Equals |
| Greater than or equals |
| Less than or equals |
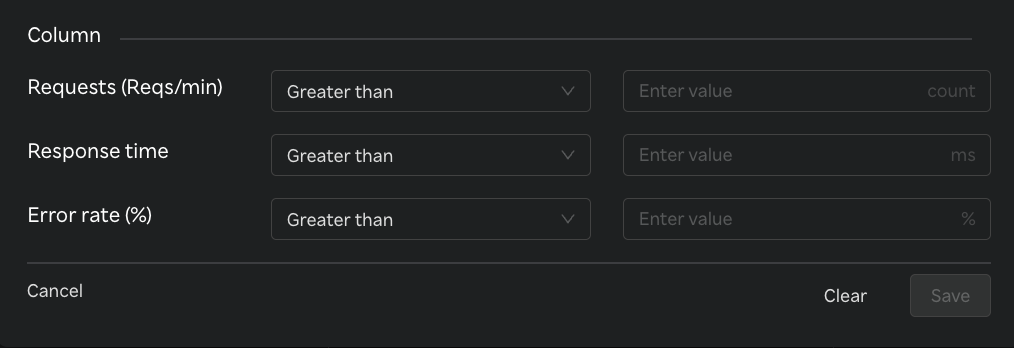
- Once filters & conditions are applied save button is enabled & click "Save" to apply the filter.
- Once filters & conditions are applied it displays no. of filters are applied.
note
- Filters are applied using AND logic — all specified conditions must be met for a record to be displayed.
- Only numeric columns support filtering; non-numeric fields (e.g., text or categorical values) are excluded from the filter options.
- If no records match the selected filters, the table will display a message such as “No data".
- The multi-column filter state persists until the user clears filters by clicking on "Clear" button when Filter by button is clicked.
- A "Reset" button is available to clear all applied filters and restore the table to its original, unfiltered state. This button is enabled only when one or more filters are currently applied.
Top locations
- Multi-column filter can be applied on numeric columns within the Top locations Table ( Mobile monitoring --> KPI --> Performance --> Top locations --> View all ) to refine the displayed data based on specific conditions.
- When the user clicks on the “Filter by” option, user can apply filter below numeric columns
| Column Name | Description |
|---|---|
| No. of requests | Total number of HTTP requests originating from the specific location. |
| HTTP response time | Average time taken to receive a response for the requests from that location. |
| Error rate (%) | Percentage of requests from that location that resulted in errors. |
- Each filter condition is applied using the below operators and value ( user input based on the unit)
| Operator |
|---|
| Greater than |
| Less than |
| Equals |
| Greater than or equals |
| Less than or equals |
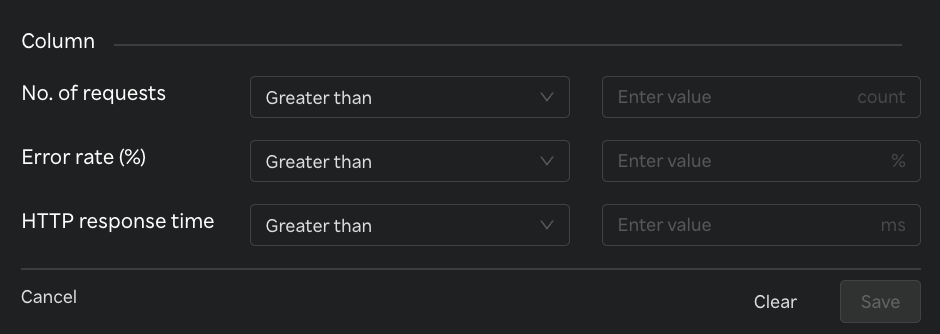
- Once filters & conditions are applied save button is enabled & click "Save" to apply the filter.
- Once filters & conditions are applied it displays no. of filters are applied.
note
- Filters are applied using AND logic — all specified conditions must be met for a record to be displayed.
- Only numeric columns support filtering; non-numeric fields (e.g., text or categorical values) are excluded from the filter options.
- If no records match the selected filters, the table will display a message such as “No data".
- The multi-column filter state persists until the user clears filters by clicking on "Clear" button when Filter by button is clicked.
- A "Reset" button is available to clear all applied filters and restore the table to its original, unfiltered state. This button is enabled only when one or more filters are currently applied.