RDS Architecture
Following is the RDS architecture diagram and the explanation in detail.
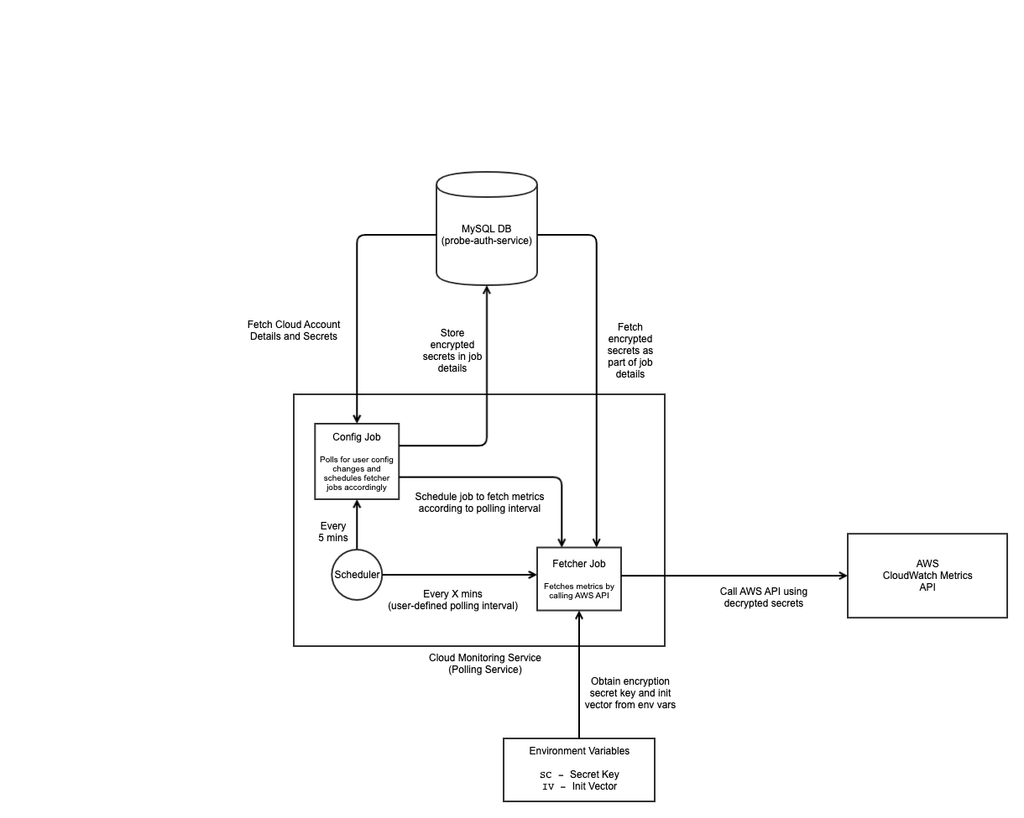
Once you configure a cloud account from the Integrations capability in the SixthSense portal, the SixthSense Cloud Monitoring Service picks up the configuration through its root scheduler that runs every minute to schedule the metric fetch job as per the configuration you have set.
The metric fetch job is scheduled either on quartz job scheduler or an java's scheduled executor service based on the deployment configurations.Once the metric fetch job is scheduled, the job kicks in every x minute (pulling interval you have configured) and fetches metrics as per the configuration. If at some point the job fails, it is pushed to a retry scheduler (executor service) with maximum 3 retries.
The fetched metrics are converted into MeterData payloads and pushed to the collecter service and persisted into Open Search. The dashboard UI queries Open Search to display the metrics for a given window in time.
Metric Fetching details
The first time a configuration is set, metrics are fetched for the last 15 Minutes, and not beyond that. If the fetch is disabled from the UI, metric fetch is stopped. When you enable it back, metrics are fetched from the last time it was fetched to the current time or for the last 15 minutes whichever is minimum.
When a new resource is added on the cloud provider (For example, a new RDS instance added on AWS), resource discovery on the SixthSense dashboard will happen within a maximum of 10 minutes (configurable at deployment).