Elasticache dashboard
- Navigate to Cloud monitoring on the left pane in the Observability portal.
- Select AWS cloud from the Select cloud drop-down list.
- Select ELASTICACHE service from the Select service drop-down list.
- Select a connection name from the Select connection name drop-down list.
A screen similar to the following appears.
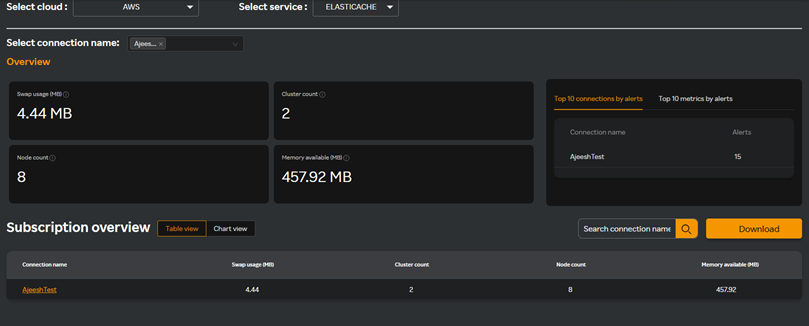
The Overview pane displays the following metrics.
| Metric name | Description |
|---|---|
| Swap usage (MB) | Refers to the amount of memory that has been moved from physical RAM to disk storage (swap space) when the system runs out of available RAM. By keeping swap usage low or at zero, you can ensure optimal performance of your ElastiCache cluster. |
| Cluster count | Refers to the number of clusters you have deployed in your Elasticache environment. It provides insights into how many clusters you have deployed and helps you optimize your architecture, monitor costs, and ensure performance. |
| Node count | Refers to the total number of cache nodes (or instances) deployed within your Elasticache clusters. It is a critical metric for managing, scaling, and optimizing your ElastiCache deployment. |
| Memory available (MB) | Refers to the amount of free memory (RAM) that is not currently being used by the cache engine on a node. It is critical for ensuring the efficient operation of your Elasticache clusters. |
- Select either Top 10 connections by alerts or Top 10 metrics by alerts. These options display the alerts by connections or by metrics. For more information about configuring AWS alerts, see AWS alerts.
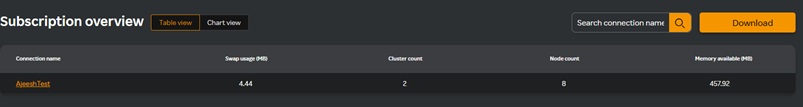
The Subscription overview pane allows you to view either the table view or chart view. Select the Table view tab which displays a table similar to the following screen with all the metric details available in the Overview pane.
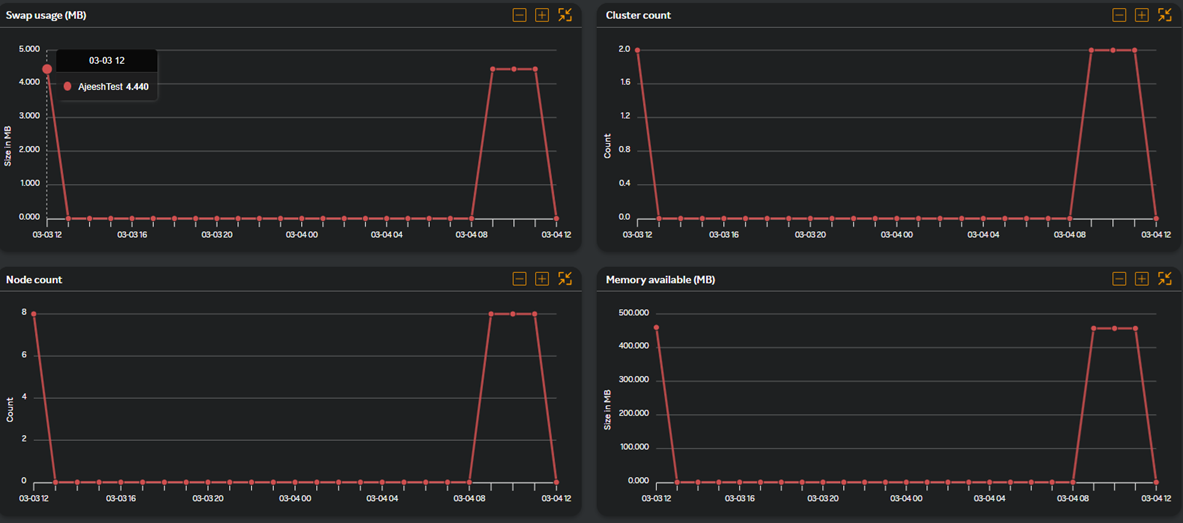
Select the Chart view tab to display graphs of metrics based on the timeline you selected in the calendar, as shown in the following screen.
Click on any connection name listed in the Connection name column under the Subscription overview pane.
The Host, Redis, and Memcached tabs are available. Host is selected by default, and a screen similar to the following appears.
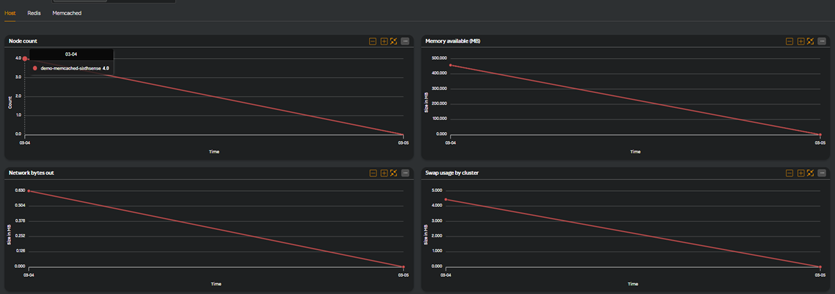
The following metrics are available in graph format with the timeline you have selected in the calendar.
| Metric name | Description |
|---|---|
| Node count | Refers to the total number of cache nodes (or instances) deployed within your Elasticache clusters. It is a critical metric for managing, scaling, and optimizing your ElastiCache deployment. |
| Memory available (MB) | Refers to the amount of free memory (RAM) that is not currently being used by the cache engine on a node. It is critical for ensuring the efficient operation of your Elasticache clusters. |
| Network bytes out | Measures the amount of data (in bytes) sent from the ElastiCache nodes to clients over the network. By regularly monitoring and analyzing this metric, you can ensure that your ElastiCache deployment is efficient, cost-effective, and capable of meeting your application's performance requirements. |
| Swap usage by cluster | Refers to the amount of memory that has been moved from physical RAM to disk storage (swap space) when the system runs out of available RAM. By keeping swap usage low or at zero, you can ensure optimal performance of your ElastiCache cluster. |
| CPU utilization by node | Refers to the percentage of CPU resources being used by an individual cache node. It is essential for understanding the performance of your ElastiCache deployment, identifying bottlenecks, and ensuring that your caching infrastructure is operating efficiently. |
| Network bytes in by cluster | Measures the total amount of data (in bytes) sent to the ElastiCache cluster from clients over the network. It is essential for understanding the workload and performance of your ElastiCache deployment. |
A screen similar to the following appears when you select the Redis tab.
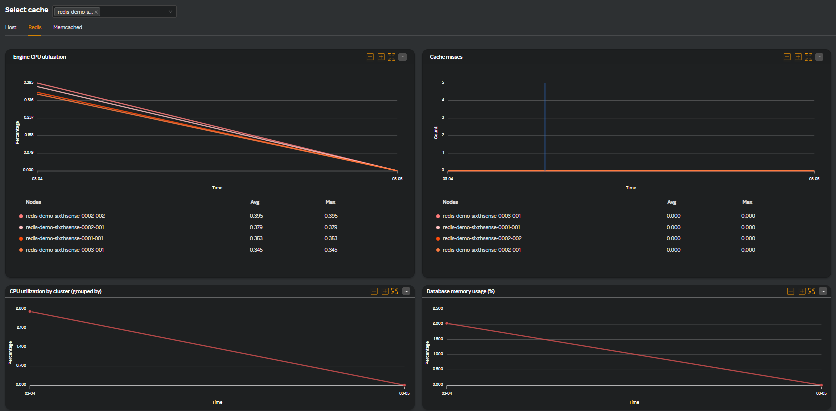
The following metrics are available in graph format with the timeline you have selected in the calendar.
| Metric name | Description |
|---|---|
| Engine CPU utilization | Refers to the percentage of CPU resources being used by the cache engine process (Redis or Memcached) on a node. It is useful for monitoring cache performance, identifying bottlenecks, scaling decisions, workload distribution and so on. |
| Cache misses | Cache misses are a key metric that indicates how effectively your cache is being utilized. Monitoring and analyzing cache misses is critical for understanding the efficiency of your caching strategy and optimizing the performance of your application. |
| CPU utilization by cluster (grouped by) | Refers to monitoring the CPU usage of all nodes within an ElastiCache cluster, grouped by specific criteria such as node type, cluster and so on. It provides detailed insights into the performance of your ElastiCache clusters. |
| Database memory usage (%) | Refers to the amount of memory being used by the cache engine to store data, metadata, and other internal structures. It is essential for ensuring the efficient operation of your ElastiCache deployment. It helps you understand how memory is being utilized, optimize your caching strategy, and plan for scaling. |
| Replication bytes | Refers to the amount of data (in bytes) being transferred between the primary node and its replica nodes during the replication process. It help monitor replication traffic, ensures replication health, troubleshooting and debugging and so on. |
| New connections | Refers to the number of new client connections being established with the cache nodes over a given period of time. It is critical for understanding the behavior of your application, optimizing connection management, and ensuring the stability of your ElastiCache deployment. |
| Bytes used for cache | Measures the amount of memory (in bytes) currently being used by the cache engine to store data. It is essential for understanding how memory is being utilized in your ElastiCache deployment. It helps you optimize your caching strategy, prevent performance issues, and plan for scaling. |
| Cache hit rate | Measures the percentage of requests that are successfully served from the cache, as opposed to being fetched from the underlying data source. It is a key indicator of how effectively your cache is being utilized. |
| Evictions by clusters | These occur when the cache runs out of available memory, and the cache engine (Redis or Memcached) removes existing keys to make room for new data. It is essential for understanding the memory usage and efficiency of your ElastiCache deployment. |
| Current connections | Refers to the total number of active client connections to a cache node at a given point in time. It is essential for understanding the connection behavior of your application, optimizing connection management, and ensuring the stability of your ElastiCache deployment. |
A screen similar to the following appears when you select the Memcached tab.
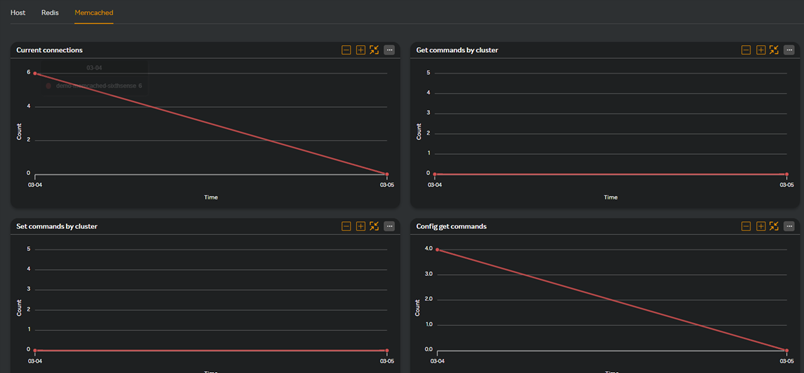
The following metrics are available in graph format with the timeline you have selected in the calendar.
| Metric name | Description |
|---|---|
| Current connections | Refers to the total number of active client connections to a cache node at a given point in time. It is essential for understanding the connection behavior of your application, optimizing connection management, and ensuring the stability of your ElastiCache deployment. |
| Get commands by cluster | Refers to the number of read requests made by clients to retrieve data from the cache. It is essential for understanding the read workload of your ElastiCache deployment, optimizing performance, and ensuring that your cache is being used effectively. |
| Set commands by cluster | Refers to the number of write requests made by clients to store or update data in the cache. is essential for understanding the write workload of your ElastiCache deployment, measuring cache utilization, improving application performance, and analyzing application behavior. |
| Config get commands | This metric is used to retrieve the current configuration parameters of a Redis node. It is important for understanding how often clients are querying the configuration of your Redis nodes and helps debugging and troubleshooting, monitoring configuration changes and so on. |
| Config set commands | This metric is used to dynamically modify the configuration parameters of a Redis node without requiring a restart. It helps in dynamic configuration changes, debugging and troubleshooting, ensures configuration consistncy, and so on. |
| New connections | Refers to the number of new client connections being established with the cache nodes over a given period of time. It is critical for understanding the behavior of your application, optimizing connection management, and ensuring the stability of your ElastiCache deployment. |
| Evictions by clusters | Occurs when the cache runs out of available memory, and the cache engine (Redis or Memcached) removes existing keys to make room for new data. It is critical for understanding how memory is being managed in your cache. |
| CPU utilization by cluster | Refers to the percentage of CPU resources being used by all nodes within a specific ElastiCache cluster. It is essential for understanding the performance of your ElastiCache deployment, identifying bottlenecks, and ensuring efficient resource usage. |
| Bytes used for hash | Refers to the amount of memory (in bytes) used by hash data structures in a Redis node within AWS ElastiCache. It is essential for understanding how memory is being utilized by hash data structures in your Redis nodes. |
| CAS hit rate | Refers to the percentage of successful Check-And-Set (CAS) operations in Memcached. It is essential for understanding the efficiency of CAS operations in your Memcached deployment. |
| Get commands by node | Refers to the number of read requests (or GET operations) made by clients to retrieve data from a specific cache node. It is essential for understanding the read workload on individual nodes, optimizing performance, and ensuring that your ElastiCache deployment is operating efficiently. |
| Set commands by node | Refers to the number of write requests (or SET operations) made by clients to store or update data in a specific cache node. It is essential for understanding the write workload on individual nodes, optimizing performance, and ensuring that your ElastiCache deployment is operating efficiently. |
| CAS miss rate | Refers to the percentage of Check-And-Set (CAS) operations in Memcached that fail. It is essential for understanding the efficiency of CAS operations in your Memcached deployment. |
- Search for a function from the Search functions field.
- Click the Download tab downloads the function detail report in PDF format.
For more information about working with a widget, see Working with a widget.