License usage dashboard
- Navigate to Usage on the left pane in the SixthSense portal page The Usage dashboard page appears.
- Click License usage.
By default, the Overview tab is selected.
Overview
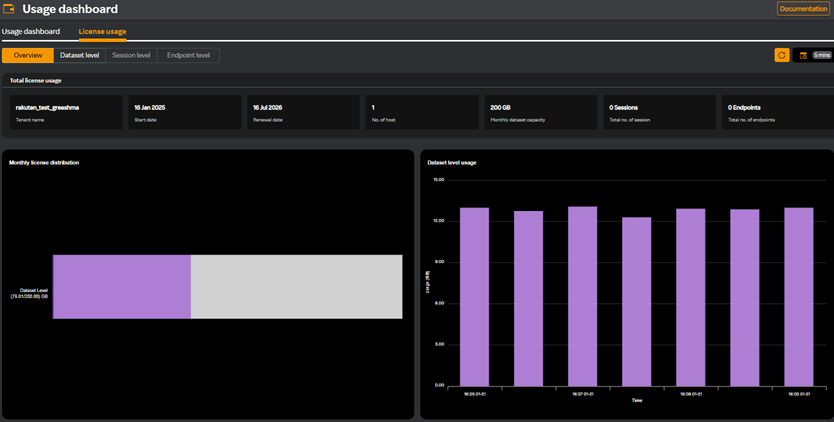
The top banner contains the Total license usage details as in the following screen.
| Card name | Description |
|---|---|
| Tenant name | Your tenant name |
| Start date | The date on which the license was uploaded. |
| Renewal date | The date on which the license must be renewed. |
| No. of host | The number of devices that can connect to a network. |
| Monthly dataset capacity | The amount of data a user or organization is allowed under the licensing agreement. |
| Total no. of session | The number of individual user sessions or connections that a licensed product can accommodate over a given period. |
| Total no. of endpoints | The maximum number of devices or systems that can be connected under the licensing agreement. |
The license dashboard contains the following widgets.
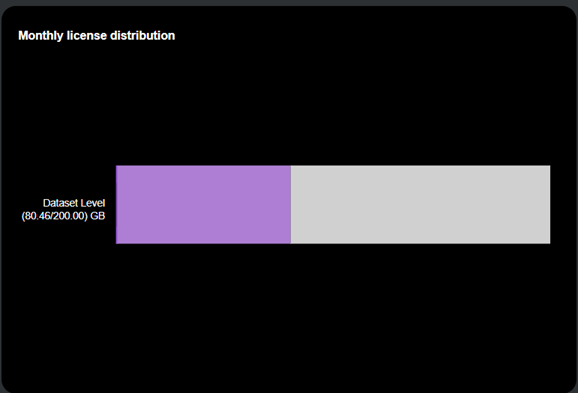
Monthly license distribution
This widget refers to the allocation, usage, and management of licenses based on the data processing, access, or storage limits specified in a license agreement. In the following screen, you can see that about 80.45 GB is used out of the 200 GB allocated.
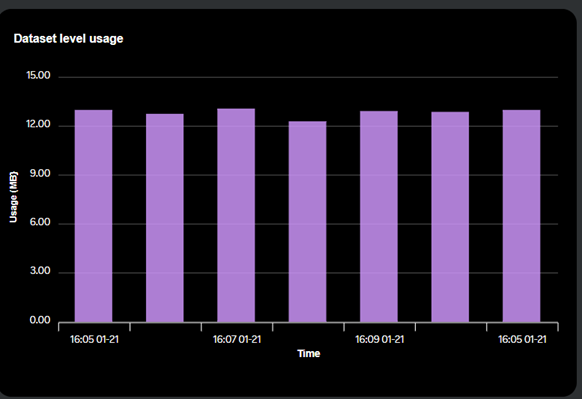
Dataset level usage
This widget displays the number of datasets that can be processed, stored, or accessed under the terms of a licensing agreement within a month. In the following screen, you can see the data set usage in MB based on the time period you have selected.
Dataset level
- Navigate to Usage on the left pane in the SixthSense portal page The Usage dashboard page appears.
- Click License usage.
- Click the Dataset level tab.
The following screen appears.
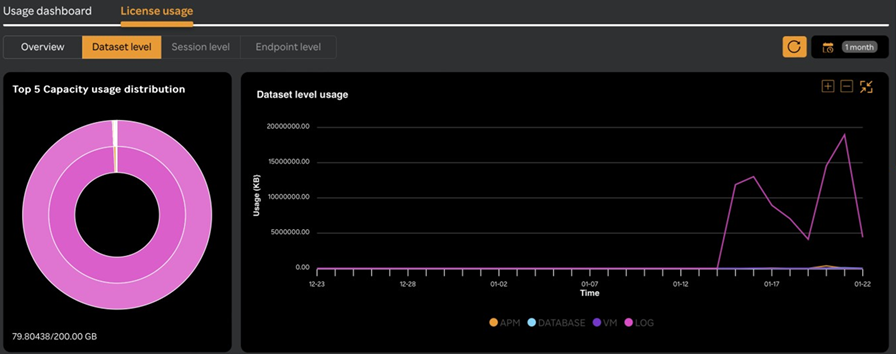
Top 5 capacity usage distribution card
You can see a pie chart in the Top 5 capacity usage distribution card. It displays the total amount of data a user can store, process, or analyze under a license in gigabytes (GB) below the pie chart. The pie chart shows how the data is used by each tenant when you click on it.
Dataset level usage widget
In this widget you can see the graph usage of the dataset level. The legend displays the capability names and are color coded. Hovering on the graph shows the dataset usage for each capability in KB during a particular time.
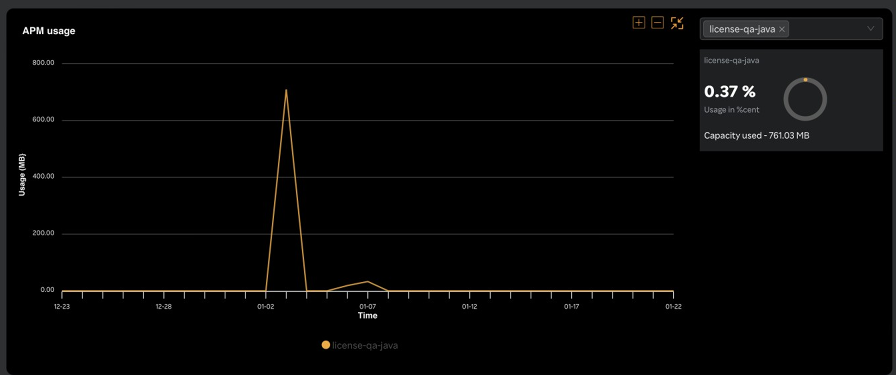
APM usage widget
You can select an application within a capability in the top right corner of the widget and view a pie chart of the usage in percentage and the capacity used.
The graph below displays the selected application's usage in bytes for the selected time period.
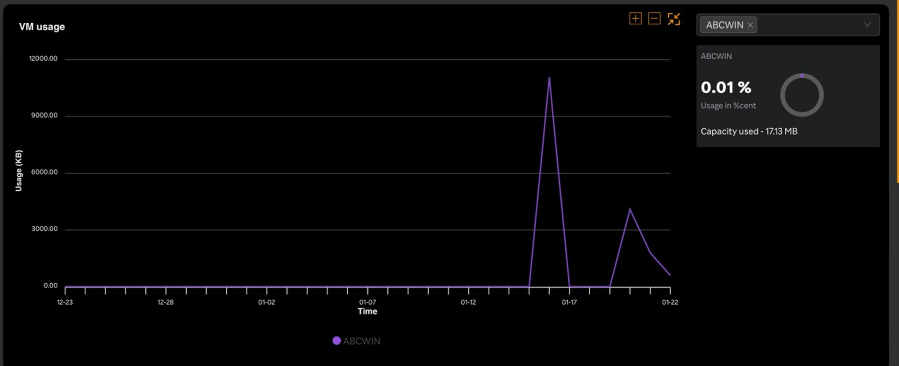
VM usage widget
You can select an application within a capability in the top right corner of the widget and view a pie chart of the usage in percentage and the capacity used.
The graph below displays the selected application's usage in bytes for the selected time period.
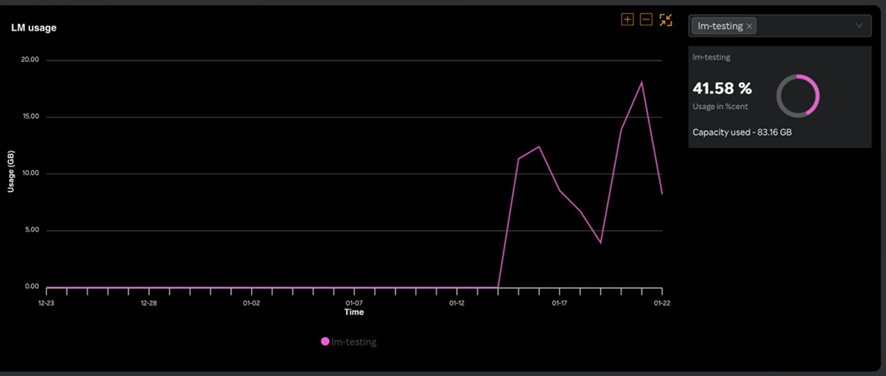
LM usage widget
You can select an application within a capability in the top right corner of the widget and view a pie chart of the usage in percentage and the capacity used.
The graph below displays the selected application's usage in bytes for the selected time period.
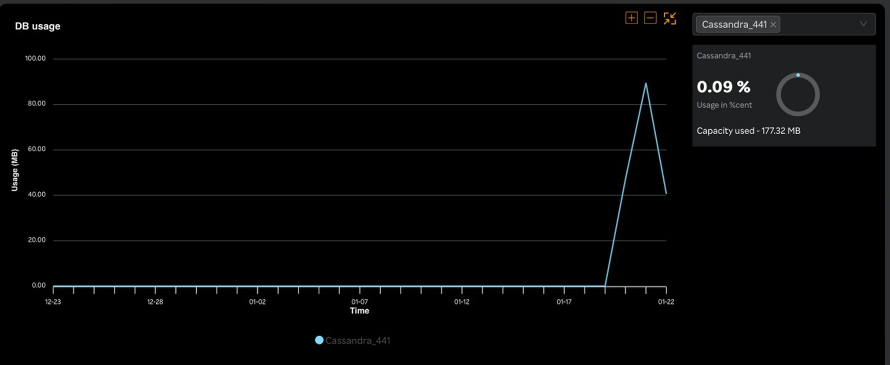
DB usage widget
You can select an application within a capability in the top right corner of the widget and view a pie chart of the usage in percentage and the capacity used.
The graph below displays the selected application's usage in bytes for the selected time period.