MongoDB
Use the following procedure for monitoring the MongoDB database.
- Navigate to Database monitoring on the left pane.
- Select MongoDB from the Select database drop-down list.
- Select a service from the Select service drop-down list.
- Select a database from the Select database drop-down list.
A screen similar to the following appears along with the various available tabs.

Hardware
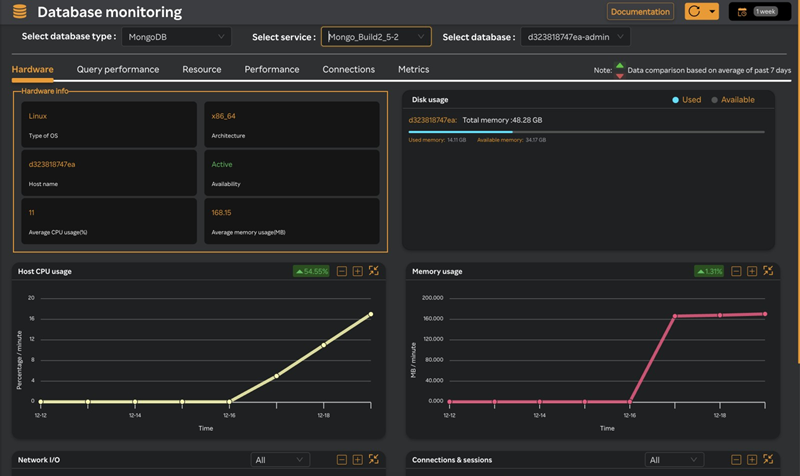
The Hardware tab is selected by default. The following widgets are displayed.
| Widget Name | Description |
|---|---|
| Disk usage | Disk utilization of host |
| Host CPU usage | CPU utilization of host |
| Memory usage | Memory utilization of host |
| Netowork I/O | Network input/output data in MB |
| Connections & sessions | database number of connections & sessions count |
Query Performance
Clicking the Query Performance tab and selecting the threshold from the Query threshold drop-down list displays the following screen.
note
You can download the Query Performance table in PDF format by clicking the ![]() icon. Only the top 100 entries are downloaded if there are more than 100 entries for downloading.
icon. Only the top 100 entries are downloaded if there are more than 100 entries for downloading.
Resource
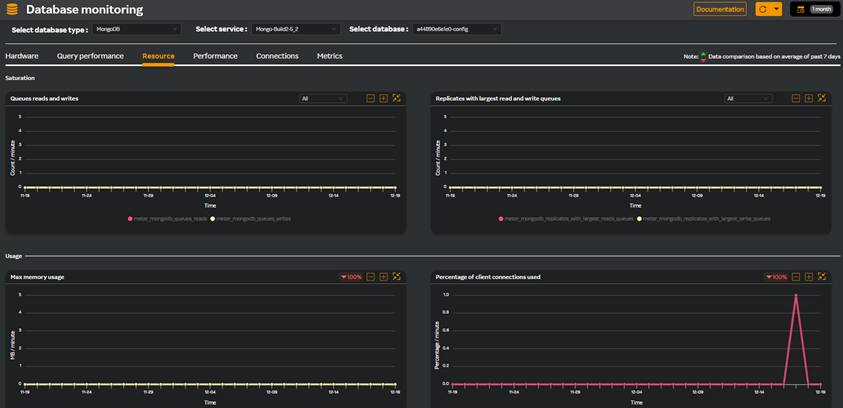
Clicking the Resource tab displays the following widgets as in the following screen.

| Widget Name | Description |
|---|---|
| Queues reads and writes | Database receives more requests than it can process immediately. |
| Replicates with largest read and write queues | Replicas within a replica set can experience large read and write queues due to various factors. |
| Max memory usage | Depends on several factors, including the server's available physical memory (RAM), the configured WiredTiger cache size, and the operating system. |
| Percentage of client connections used | indicates how many of the available connections are currently being utilized. |
| Number of page faults per host | Page faults occur when the database attempts to access data that is not currently in memory (RAM) and must retrieve it from disk. |
| Number of assets | Number of assets could refer to documents, collections, databases, or indexes. |
Performance
Clicking the Performance tab displays the following widgets.
| Widget Name | Description |
|---|---|
| Max replication lag | Refers to the delay between when a write operation is applied on the primary node and when the same operation is replicated to a secondary node in a replica set. |
| Number of open cursors per replicaset | Refers to an object that allows a client application to iterate over the results of a query. Tracking the number of open cursors could indicate inefficient queries, poorly managed connections and so on potentially impacting performance. |
| Number of timed out cursors per replicaset | Occurs when a query cursor exceeds the timeout threshold and is automatically closed by the server. |
| Avg duration of background per replicaset | Refers to the average time taken by background tasks within a replica set. |
| Read request | Refers to a request made by a client application to retrieve data from the database. |
| Write request | Refers to any operation that modifies data in the database. |
| Most used replicasets for reads | The read operations can be directed to different members of the replica set depending on the read preference specified. |
| Most used replicasets for writes | Write operations are always directed to the primary replica in a replica set. |
| Number of clients with read in-progress or queued | Refers to the number of client connections that are either actively executing read operations or have read requests that are waiting to be processed. |
| Number of clients with write in-progress or queued | Refers to the number of client connections that are either actively executing write operations or have write operations that are waiting to be processed. |
Connections
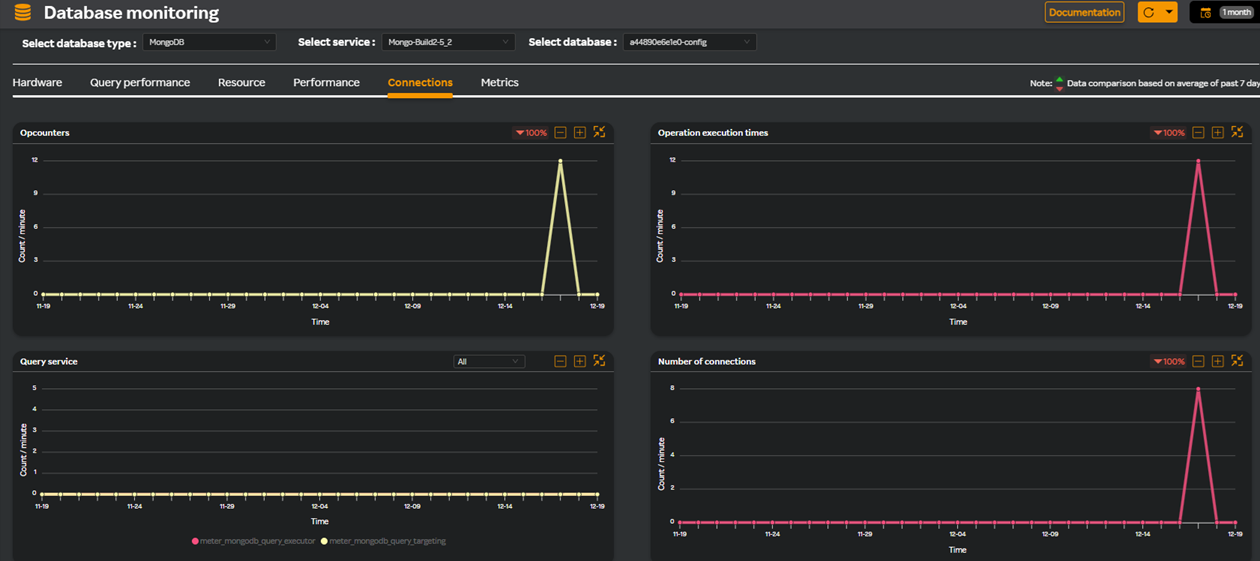
Clicking the Connections tab displays the following widgets as in the following screen.

| Widget Name | Description |
|---|---|
| Opcounters | refers to operation counters that track the number of database operations executed. |
| Operation execution times | measures the amount of time it takes to execute database operations such as queries, updates, inserts, and deletes. |
| Query service | is responsible for processing and executing queries submitted to the database. |
| Number of connections | refers to the total number of client connections established with the database server. |
| Queues | refers to the number of operations (reads or writes) waiting to be processed by the database. |
| Scan and order | refers to situations where the database must scan documents in a collection and sort them in memory to fulfill a query's sorting requirement. |
Metrics
Clicking the Metrics tab displays the following widgets as in the following screen.

| Widget/Legend Name | Description |
|---|---|
| Asserts | The number of message asserts. These are internal server errors that have a well defined text string. Stack traces are logged for these. |
| meter_mongodb_asserts_msg | The number of message asserts. These are internal server errors that have a well defined text string. Stack traces are logged for these. |
| meter_mongodb_asserts_regular | The number of regular asserts raised since this process started. |
| meter_mongodb_asserts_user | The number of user asserts. These are errors that can be generated by a user such as out of disk space or duplicate key. |
| meter_mongodb_asserts_warning | The number of warnings raised since this process started. |
| Background flusing flushes | BackgroundFlushing_flushes: The number of times the database has flushed all writes to disk. |
| Background flusing total | The number of milliseconds (ms) that the mongod processes have spent writing (i.e. flushing) data to disk. |
| meter_mongodb_connections_available | The number of unused available connections that the database can provide. Consider this value in combination with the value of current to understand the connection load on the database, and the UNIX ulimit Settings document for more information about system thresholds on available connections. |
| meter_mongodb_connections_current | The number of connections to the database server from clients. This number includes the current shell session. Consider the value of available to add more context to this datum. This figure will include the current shell connection as well as any inter-node connections to support a replica set or sharded cluster. |
| meter_mongodb_cursor_timed_out | The number of cursors that have timed out since the server process started. If this number is large or growing at a regular rate, this may indicate an application error. |
| meter_mongodb_cursor_total_open | The number of cursors that MongoDB is maintaining for clients. Because MongoDB exhausts unused cursors, typically this value small or zero. However, if there is a queue, stale tailable cursors, or a large number of operations this value may rise. |
| meter_mongodb_global_lock_active_clients | The number of connected clients. |
| meter_mongodb_global_lock_current_queue | The number of operations queued waiting for the lock. A consistently small queue, particularly of shorter operations should cause no concern. Also, consider this value in light of the size of queue waiting for the read lock (e.g. readers) and write lock (e.g. writers) individually. |
| Memory | A critical resource in MongoDB, affecting the performance and scalability of the database. MongoDB uses memory for caching data, indexes, journaling, and managing client connections, among other tasks. |
| meter_mongodb_mem_mapped | The number of megabytes of memory mapped by the database. Because MongoDB uses memory-mapped files, this value will be roughly equivalent to the total size of your databases. |
| meter_mongodb_mem_resident | The amount of RAM, in megabytes (MB), currently used by the database process. In normal use this value tends to grow. In dedicated database servers this number tends to approach the total amount of system memory. |
| meter_mongodb_mem_virtual | The quantity, in megabytes (MB), of virtual memory used by the mongod process. With journaling enabled, the value of virtual is at least twice the value of mapped. If virtual value is significantly larger than mapped (e.g. 3 or more times), this may indicate a memory leak. |
| Network_bytesIn | The amount of network traffic, in bytes, received by this database. Use this value to ensure that network traffic sent to the mongod process is consistent with expectations and overall inter-application traffic. |
| Network_bytesOut | The amount of network traffic, in bytes, sent from this database. Use this value to ensure that network traffic sent by the mongod process is consistent with expectations and overall inter-application traffic. |
| Network_numRequests | The number of distinct requests that the server has received. Use this value to provide context for the bytesIn and bytesOut values to ensure that MongoDB network utilization is consistent with expectations and application use. |
| Oplog | A special capped collection in MongoDB that records all changes to the data in a replica set. |
| meter_mongodb_opcounter_command | The number of commands sent to MongoDB. |
| meter_mongodb_opcounter_delete | The number of Delete operations. |
| meter_mongodb_opcounter_getmore | The number of GetMore operations. |
| meter_mongodb_opcounter_insert | The number of Insert operations. |
| meter_mongodb_opcounter_query | The number of Query operations. |
| meter_mongodb_opcounter | The number of Update operations. |
| meter_mongodb_oplog_max_size | The maximum size of the operation log |
| meter_mongodb_oplog_size | The size of the operation log |
| meter_oplog_time_diff_in_sec | The difference (in seconds) between the first entry in the log and the last entry in the log |
| Replicate | Refers to the process of synchronizing data across multiple servers to ensure high availability, fault tolerance, and redundancy. |
| meter_mongodb_repl_command | The number of Replicated Commands issued to the database. |
| meter_mongodb_repl_delete | The number of Replicated Delete operations. |
| meter_mongodb_repl_getmore | The number of GetMore operations. This counter can be high even if the query count is low. Secondary nodes send getMore operations as part of the replication process. |
| meter_mongodb_repl_insert | The number of replicated insert operations. |
| meter_mongodb_repl_query | The number of Replicated Queries. |
| meter_mongodb_repl_update | The number of Replicated Update Operations. |
| Replication_Mystate | ndicates the current state of a member within a replica set. |
| Replication_MyState | An integer between 0 and 10 that represents the replica state of the current member. |
| Index_MissRatio | Ratio of index hits to misses. If there are a lot of index misses then you should look at your queries to see if they are optimally using your indexes. You may need to add new indexes to make the queries run faster. You can explain the query to see which index queries are hitting and the total execution time so you can compare query performance before and after adding the new indexes. |
Multi-column Filter
Query performance
- Multi-column filter can be applied on numeric columns within the Query performance Table to refine the displayed data based on specific conditions.
- When the user clicks on the “Filter by” option, user can apply filter below numeric columns
| Column Name | Description |
|---|---|
| Total execution | Total number of query executions recorded. |
| Maximum execution time (s) | The longest query execution time recorded in seconds. |
| Maximum execution timestamp | Date and time when the longest-running query was recorded. |
- Each filter condition is applied using the below operators and value ( user input based on the unit)
| Operator |
|---|
| Greater than |
| Less than |
| Equals |
| Greater than or equals |
| Less than or equals |

- Once filters & conditions are applied save button is enabled & click "Save" to apply the filter.
- Once filters & conditions are applied it displays no. of filters are applied.

note
- Filters are applied using AND logic — all specified conditions must be met for a record to be displayed.
- Only numeric columns support filtering; non-numeric fields (e.g., text or categorical values) are excluded from the filter options.
- When the Maximum Execution Timestamp (s) filter is applied, the system reviews each query in the table. If a query was executed within the time frame selected in the top-right corner, it displays that query’s maximum execution timestamp and maximum execution time.
- If no records match the selected filters, the table will display a message such as “No data".
- The multi-column filter state persists until the user clears filters by clicking on "Clear" button when Filter by button is clicked.
- A "Reset" button is available to clear all applied filters and restore the table to its original, unfiltered state. This button is enabled only when one or more filters are currently applied.
