Enabling code profiler from APM
You can enable code profiler from the APM capability option available in the SixthSense portal.
- Navigate to APM on the left pane in the SixthSense portal. The Dashboard tab is selected by default.
- Click the Instance tab.
The following screen appears.
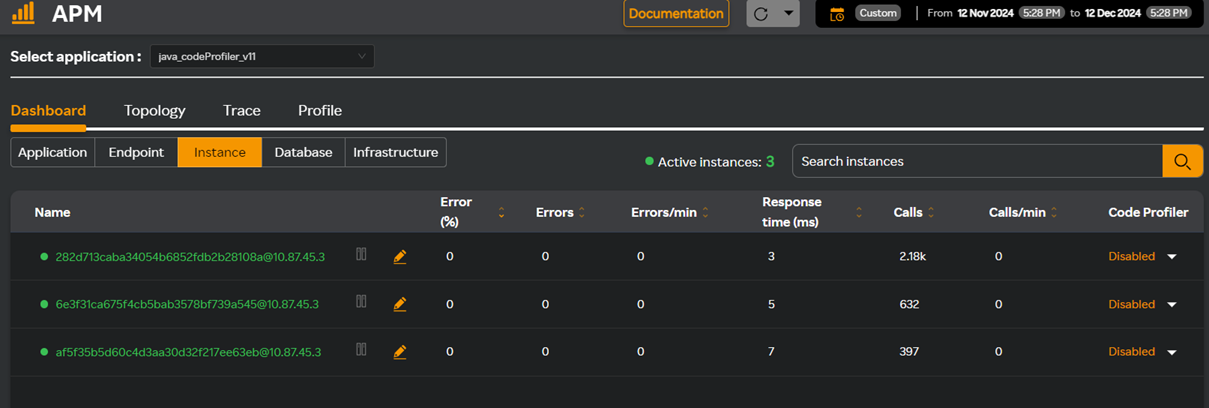
In this screen you can see that the code profiler is disabled for all instances.
- Click the Disabled drop-down icon.
The following window appears.
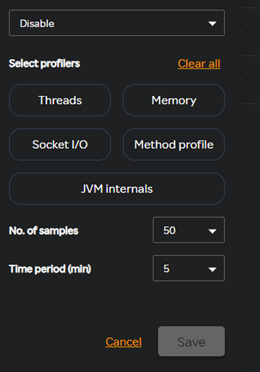
- Select Enable from the Disable drop-down list.
- Select the profilers you want to enable.
- Select the number of samples from the No. of samples drop-down list.
- Select the time period in minutes from the Time period drop-down list.
- Click Save.
You can also enable code profiles from the Settings page available in the SixthSense portal on the left pane. For more information, see Enabling code profiler.