Method Level Profile
This feature refers to the detailed performance data collected and analyzed at the level of individual methods or functions within an application. This level of profiling provides granular insights into how specific methods or functions in the code are performing, helping developers and operations teams optimize code, resolve issues, and enhance overall application performance.
- Navigate to APM in the SixthSense AO portal.
- Select an application from the Select application field.
- Click the Profile tab.
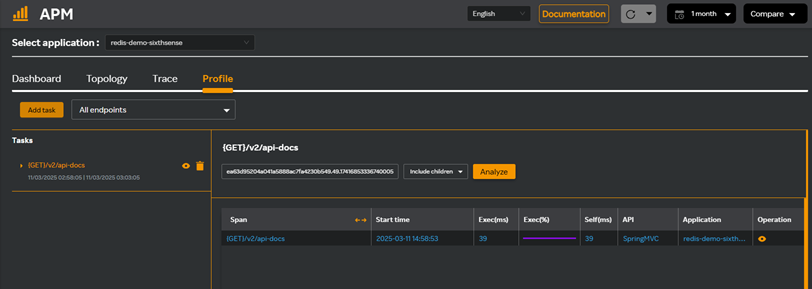
The following Profile dashboard appears.

You can perform the following tasks from this dashboard.
- Add tasks. For adding tasks, see Adding a task.
- View task details. Click the
icon against the task in the Tasks pane to view the tasks you have already added.
- Delete tasks. Click the
 icon against the task in the Tasks pane to delete the task.
 - Select Include children or Exclude children next to the trace id field from the drop-down list. Including children analyzes the performance of an endpoint and all the subtasks that are triggered as part of the endpoint's execution.
- Click Analyze to analyze the tasks.
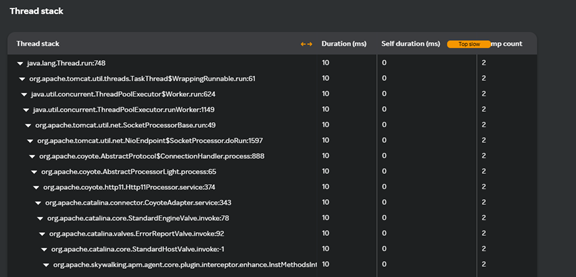
If you have included children and clicked analyze, a screen similar to the following appears where all the thread stack details are displayed.

The table contains the following details.
| Column Name | Description |
|---|---|
| Span | Represents a single operation or task that is part of the endpoint's execution. Spans provide detailed insights into the performance of individual tasks, their relationships (parent-child hierarchy), and their impact on the overall performance of an endpoint or application. |
| Start time | The timestamp that marks the beginning of a task. You can identify bottlenecks, detect delays, and optimize the performance of your application by analyzing start times. |
| Exec(ms) | It is a critical metric for understanding the performance of individual tasks and their contribution to the overall response time of an endpoint. It helps identify which tasks are consuming the most processing time and whether they can be optimized. |
| Self(ms) | Refers to the time spent directly executing a task, excluding the time spent in its child tasks. This metric helps youunderstand the impact of dependencies on the performance of an endpoint. |
| API | Represents the parent task that processes incoming requests and generates responses. Monitoring APIs as tasks helps you understand their performance, dependencies, and impact on the overall application. |
| Application | Application is the software system that processes requests, executes tasks, and so on. Monitoring the application provides end-to-end visibility into how requests flow through the system, helping identify bottlenecks, optimize performance, and ensure reliability. |
| Operation | Refers to a specific action or task that is performed as part of processing a request to an endpoint. By analyzing operations, you can identify bottlenecks, optimize performance, and ensure that the application meets user expectations. |
- Click the
icon against any row in the table to view the span info screen where you can view all the span details and download the report.
Adding a task
- Click Add task from the Profile dashboard.
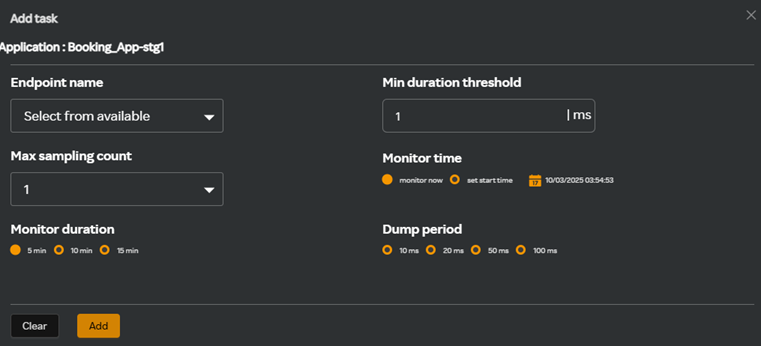
The Add task screen appears.

- Complete the following fields in the Add task screen.
| Field | Description |
|---|---|
| Endpoint name | Name for the endpoint. |
| Min duration threshold | This is a configurable value that filters out tasks or spans with durations below a certain threshold. It helps reduce noise, improve the performance of APM tools, and focus on tasks that have a meaningful impact on application performance. |
| Max sampling count | It is a configurable limit that determines the maximum number of traces or tasks the APM tool will capture and analyze within a specific time period. It helps reduce overhead, improve performance, and focus on representative data, especially in high-traffic applications. |
| Monitor time | Refers to the time period during which the APM tool collects and analyzes performance data for tasks, endpoints, or operations. It can be used for real-time monitoring, historical analysis, or focusing on specific time windows. By analyzing performance metrics over the monitoring time, you can detect anomalies, identify trends, and troubleshoot issues effectively. |
| Monitor duration | Refers to the length of time that the APM tool actively tracks and collects performance data from an application or system. It helps determine how long the APM tool will observe and log performance metrics. |
| Dump period | It is the interval at which performance data is collected, aggregated, and sent to the APM server for analysis. It plays a critical role in balancing real-time monitoring, system overhead, and data granularity. By configuring the dump period appropriately, you can optimize resource usage, detect issues in real-time, and analyze long-term trends effectively. |
- Click Add.