Dashboard
Use the application dashboard, to view statistics related to an application you select in the Select application: drop-down list. By default, the Dashboard tab is selected.
The Dashboard screen displays the following options:
Application
The Application screen displays all statistics at the API level that are related to a particular application configured on an instance.
Apdex score
The SixthSense application internally calculates the apdex score based on the performance of the application and displays the health indicator accordingly as in the following screen.
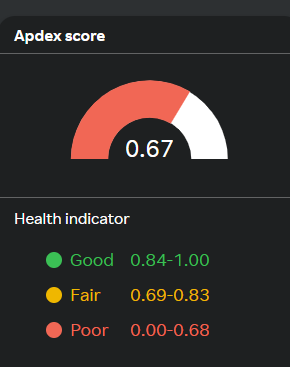
In the Health indicator pane, if you find the Apdex score denoted as Poor, go to the Endpoint by error % and Endpoints by response time(ms) tabs to take remedial action.
The SixthSense application monitors and displays the Apdex score using the following classification:
| Health Indicator Status | Apdex Score Range | Required Action |
|---|---|---|
| Good | 0.84 - 1.0 | Indicates a healthy status. No immediate action required. |
| Fair | 0.69 – 0.83 | See Endpoint by error % and Endpoints by response time(ms) tab in the screen below. |
| Poor | 0.00 – 0.68 | See Endpoint by error % and Endpoints by response time(ms) tab in the screen below. |
You can set the response time threshold value for the apdex score (in milliseconds) using Settings on the left pane. Navigate to Settings > Application > Apdex Configuration and set the value.
You can expand, contract, and reset the view to the default timeline by clicking the icons available on the top right corner of the following widgets. For more information about performing various actions, see Working with a widget.
Load widget
The Load widget is a graphical representation of the number of calls the application is receiving during a particular period similar to the following screen.
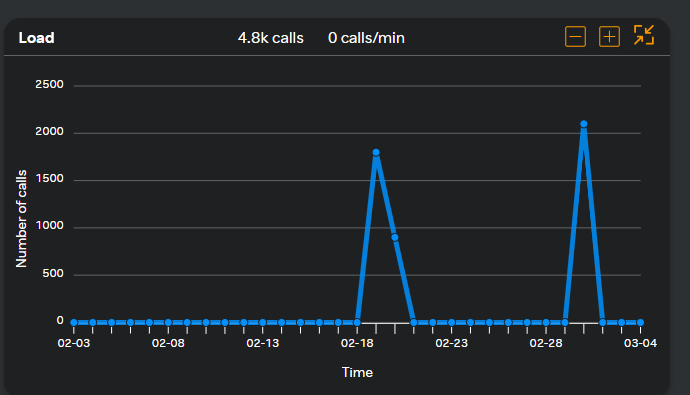
Click on any point in the graph to view the number of calls the application has received during the selected time.
Error widget
The Error widget displays a graph of the number of errors encountered by an application in a particular period similar to the following screen.
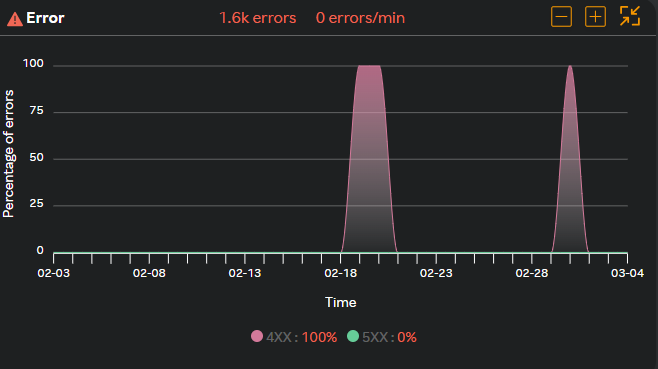
Click on any point in the graph and you can view the number of errors the application has received at that point in time.
Response time widget
The Response time widget displays the average response time taken by an application in a particular period similar to the following screen.
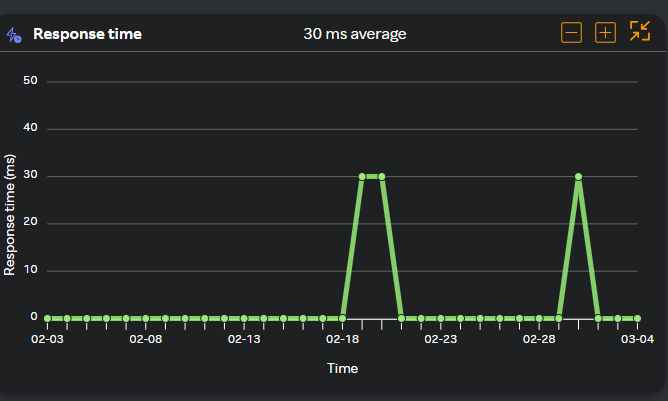
Click on any point in the graph and you can view the response time of an application at that point in time.
The following widget displays the endpoint and instances by error in % and response time in milli seconds similar to the following screen.
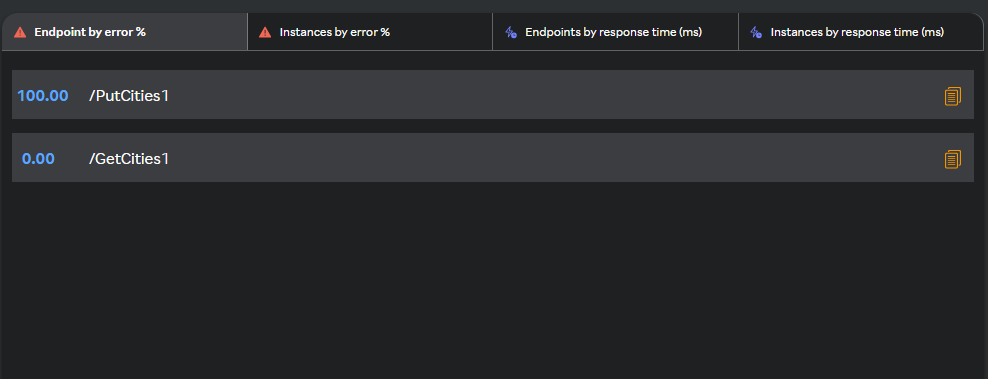
- Endpoint by error %
The SixthSense application monitors and displays errors encountered by each application endpoint as in the following screen.
This window displays the top 5 end point errors with percentage in milliseconds. By default, the top 5 endpoints that need your immediate attention are displayed. Click on an endpoint name which will take you to the Endpoint screen. For more information, see Endpoint.
note
Use the copy ![]() icon to copy the endpoint which you can use to search endpoints in other screens or widgets.
icon to copy the endpoint which you can use to search endpoints in other screens or widgets.
- Instances by error %
The Instances by error% window monitors and displays the errors that are encountered by a particular application instance where the application is installed. Click on an instance name which will take you to the Instance screen. For more information, see Instance.
- Endpoints by response time(ms)
The Endpoints by response time(ms) window monitors and displays the errors that are encountered by a particular endpoint and corresponding response time taken by the endpoint. Click on an endpoint which will take you to the Endpoint screen. For more information, see Endpoint.
- Instances by response time(ms)
The Instances by response time(ms) window monitors and displays the response time taken by an application instance. Click on an instance name which will take you to the Instance screen. For more information, see Instance.
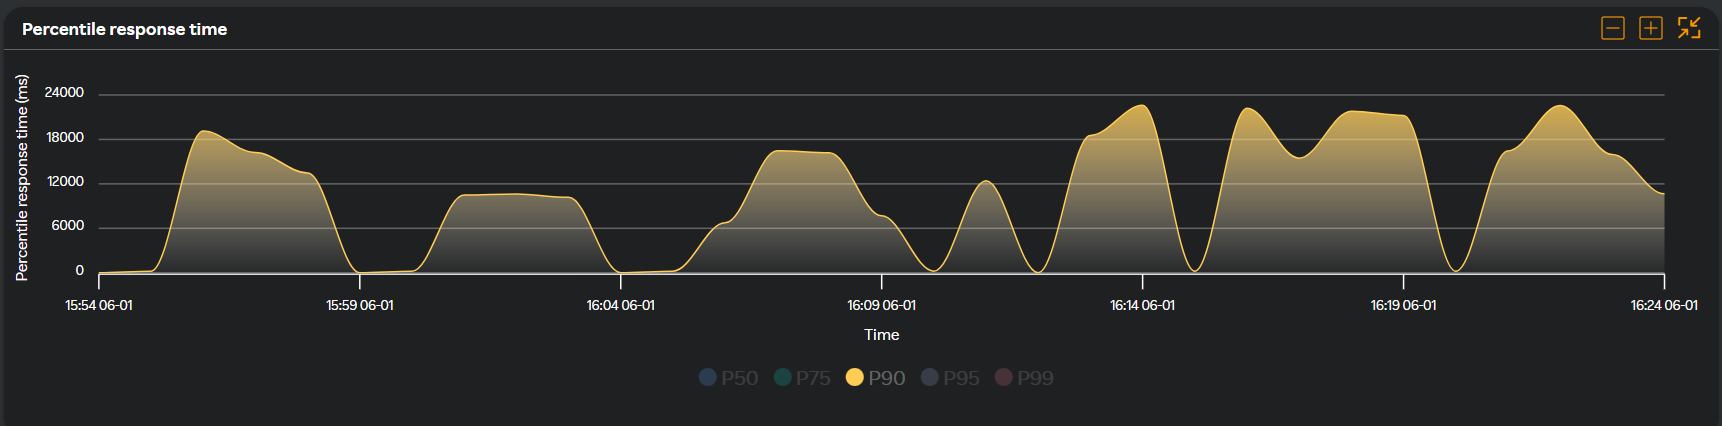
Percentile response time
You can use percentiles to understand your application performance better. In this widget, the response time values range from 0 to 24000 ms and percentiles from 50th percentile to 99th percentile. By default, all the percentile radio buttons are selected. You can select only the required percentile values: for example, P90 is selected in the following screen. You can see the response time taken by an application at 90th percentile and work on improving the application performance if the response time values are high.
Endpoint
The Endpoint screen displays the list of all the application endpoints in an instance. The following information is available on this screen when you navigate to APM > Dashboard > Endpoint.
| Field | Description |
|---|---|
| Name | Endpoint name |
| Error % | Percentage of errors occurring on a particular endpoint. |
| Errors | Number of errors occurring on a particular endpoint. |
| Errors/min | Number of errors per minute. |
| Response time (ms) | Response time taken by the endpoint. |
| Calls | Number of calls received at the endpoint. |
| Calls/min | Number of calls received per minute. |
This widget helps you understand in detail the endpoint errors. If you know the name of the endpoint, enter it in the Search endpoints field or click on an endpoint listed under the Name column.
Viewing diagnostic information to identify endpoint errors
Do any of the following in the Endpoint screen.
a. Enter or paste the name of the endpoint if you have copied the endpoint earlier in the Search endpoints field or
b. Click on an endpoint to view the endpoint dashboard where the Load, Error, Response time, and Percentile response time widgets are displayed.
Click Error Traces in the Error widget to view the list of errors for that endpoint. Complete trace level details are displayed in the Trace window to identify the errors and fix them. For more information about the Error screen, see Error trace.
Click Slow Traces in the Response time widget to view the list of endpoints that are slow. Complete trace level details are displayed in the Trace window to identify the errors and fix them. For more information about the Trace screen, see Slow trace.
Multi-column Filter
- Multi-column filter can be applied on numeric columns within the Endpoint Table to refine the displayed data based on specific conditions.
- When the user clicks on the “Filter by” option, user can apply filter below numeric columns
| Field | Description |
|---|---|
| Error % | Percentage of errors occurring on a particular endpoint. |
| Errors | Number of errors occurring on a particular endpoint. |
| Errors/min | Number of errors per minute. |
| Response time (ms) | Response time taken by the endpoint. |
| Calls | Number of calls received at the endpoint. |
| Calls/min | Number of calls received per minute. |
- Each filter condition is applied using the below operators and value ( user input based on the unit)
| Operator |
|---|
| Greater than |
| Less than |
| Equals |
| Greater than or equals |
| Less than or equals |
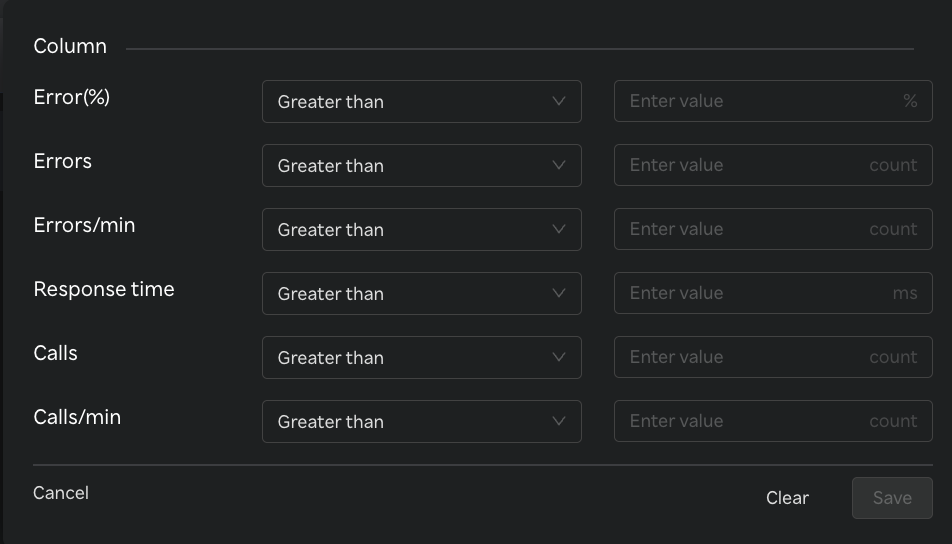
- Once filters & conditions are applied save button is enabled & click "Save" to apply the filter.
- Once filters & conditions are applied it displays no. of filters are applied.

note
- Filters are applied using AND logic — all specified conditions must be met for a record to be displayed.
- Only numeric columns support filtering; non-numeric fields (e.g., text or categorical values) are excluded from the filter options.
- If no records match the selected filters, the table will display a message such as “No data".
- The multi-column filter state persists until the user clears filters by clicking on "Clear" button when Filter by button is clicked.
- A "Reset" button is available to clear all applied filters and restore the table to its original, unfiltered state. This button is enabled only when one or more filters are currently applied.

Downloading a report
Click the  to download upto 10000 unique rows in the report in csv format.
Instance
The Instance screen displays details of all the instances on which a particular application is installed. The following information is available on this screen when you navigate to APM > Dashboard > Instance.
In the top header, you can see the number of instances that are active against the Active instances: field as in the following screen. For example, in the following screen, active instance is 1. The instances are displayed in Green color under the Name column
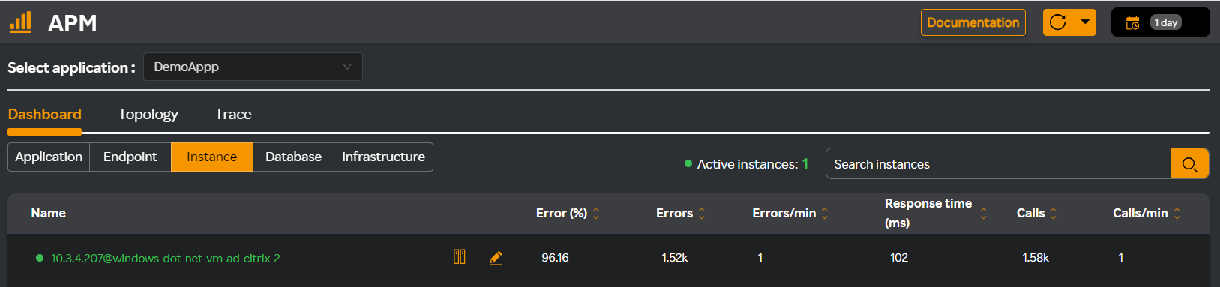
The Instance screen displays the following columns in a table format.
| Field | Description |
|---|---|
| Name | Instance name. |
| Error % | Percentage of errors occurring on a particular instance. |
| Errors | Number of errors occurring on a particular instance. |
| Errors/min | Number of errors per minute. |
| Response time (ms) | Response time taken by the endpoint. |
| Calls | Number of calls received the endpoint. |
| Calls/min | Number of calls received per minute. |
| Code Profiler | Enable code profiler from this column. For more information, see Enabling code profiler from APM. |
If you know the name of the instance, enter it in the Search instances field and click the search ![]() icon.
icon.
Click the infrastructure ![]() icon next to the instance name which will take you to the infrastructure page where you can see the VM details. For more information, see Infrastructure.
icon next to the instance name which will take you to the infrastructure page where you can see the VM details. For more information, see Infrastructure.
Click the edit ![]() icon next to the instance name. Edit the instance name in the Edit instance name window and click Update to update the instance name.
icon next to the instance name. Edit the instance name in the Edit instance name window and click Update to update the instance name.
Click on an instance listed under the Name column. You will see the instance related metric categories as in the following screen.
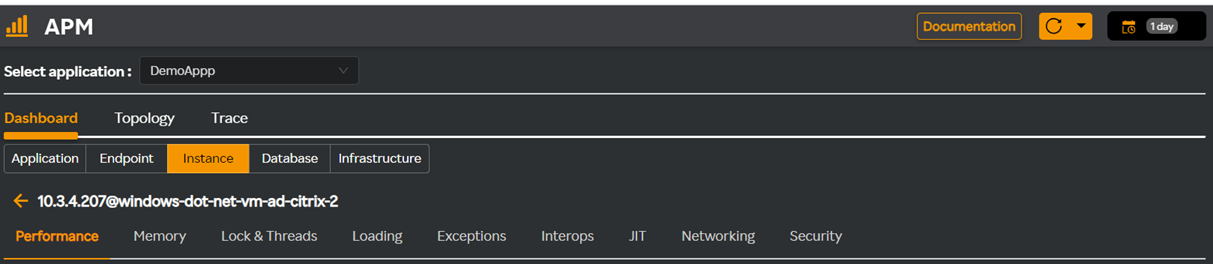
For more information about Performance metrics, see Performance metrics and for .Net metrics, see .Net metrics.
Multi-column Filter
- Multi-column filter can be applied on numeric columns within the Instance Table to refine the displayed data based on specific conditions.
- When the user clicks on the “Filter by” option, user can apply filter below numeric columns
| Field | Description |
|---|---|
| Error % | Percentage of errors occurring on a particular endpoint. |
| Errors | Number of errors occurring on a particular endpoint. |
| Errors/min | Number of errors per minute. |
| Response time (ms) | Response time taken by the endpoint. |
| Calls | Number of calls received at the endpoint. |
| Calls/min | Number of calls received per minute. |
- Each filter condition is applied using the below operators and value ( user input based on the unit)
| Operator |
|---|
| Greater than |
| Less than |
| Equals |
| Greater than or equals |
| Less than or equals |

- Once filters & conditions are applied save button is enabled & click "Save" to apply the filter.
- Once filters & conditions are applied it displays no. of filters are applied.
note
- Filters are applied using AND logic — all specified conditions must be met for a record to be displayed.
- Only numeric columns support filtering; non-numeric fields (e.g., text or categorical values) are excluded from the filter options.
- If no records match the selected filters, the table will display a message such as “No data".
- The multi-column filter state persists until the user clears filters by clicking on "Clear" button when Filter by button is clicked.
- A "Reset" button is available to clear all applied filters and restore the table to its original, unfiltered state. This button is enabled only when one or more filters are currently applied.
Downloading a report
Click the to download upto 10000 unique rows in the report in csv format.
Database
The Database screen displays a list of databases that the application is accessing. The SixthSense application has an inbuilt option that automatically detects a database, and you can view the details without installing a separate agent. If you know the name of the database, enter it in the Search databases field. The following widgets are displayed.
Overall
Click the Overall tab which displays the following widgets:
Load
The Load widget displays a graph of the number of calls a database receives during a particular period. Click on any point in the graph to view calls the database has received.
You can expand, contract, and reset the view to the default timeline by clicking the icons available on the top right corner of the Load widget. For more information about performing various actions, see Working with a widget.
Access error
The Access Error widget displays a graph of the number of errors occurred by a database during a particular period. Click on any point in the graph to view the error description.
You can expand, contract, and reset the view to the default timeline by clicking the icons available on the top right corner of the Access error widget. For more information about performing various actions, see Working with a widget.
Response time
The Response time widget displays the average response time taken by an application to access the database during a particular period.
You can expand, contract, and reset the view to the default timeline by clicking the icons available on the top right corner of the Response time widget. For more information about performing various actions, see Working with a widget.
Percentile response time
The Percentile response time widget displays the percentile time taken by an application to access the database during a particular period.
You can expand, contract, and reset the view to the default timeline by clicking the icons available on the top right corner of the Percentile response time widget. For more information about performing various actions, see Working with a widget.
Query
Click the Query tab which displays all the database queries that are triggered by an application to a database. You can view the database query along with the maximum response time (in seconds) taken by the database. The timestamp of the query along with the query count are also displayed.
note
You can also enter query in the Search Query field and click the search ![]() icon to locate and view a particular query.
icon to locate and view a particular query.
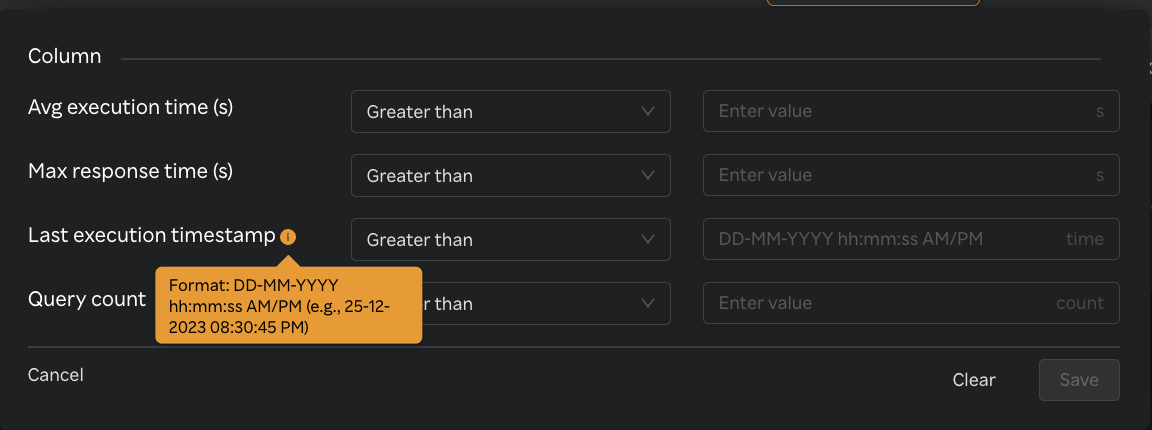
Multi-column Filter
- Multi-column filter can be applied on numeric columns within the Instance Table to refine the displayed data based on specific conditions.
- When the user clicks on the “Filter by” option, user can apply filter below numeric columns
| Field | Description |
|---|---|
| Avg execution time (s) | Average time taken to execute the query, measured in seconds. |
| Max response time (s) | Maximum response time recorded for the query, measured in seconds. |
| Last execution timestamp | Timestamp indicating when the query was last executed. |
| Query count | Total number of queries executed during the timeframe selected. |
- Each filter condition is applied using the below operators and value ( user input based on the unit)
| Operator |
|---|
| Greater than |
| Less than |
| Equals |
| Greater than or equals |
| Less than or equals |
- Once filters & conditions are applied save button is enabled & click "Save" to apply the filter.
- Once filters & conditions are applied it displays no. of filters are applied.
note
- Filters are applied using AND logic — all specified conditions must be met for a record to be displayed.
- Only numeric columns support filtering; non-numeric fields (e.g., text or categorical values) are excluded from the filter options.
- If no records match the selected filters, the table will display a message such as “No data".
- The multi-column filter state persists until the user clears filters by clicking on "Clear" button when Filter by button is clicked.
- A "Reset" button is available to clear all applied filters and restore the table to its original, unfiltered state. This button is enabled only when one or more filters are currently applied.
Downloading a report
Click the to download upto 10000 unique queries in the report in csv format.
Infrastructure
The Infrastructure screen displays details of all the instances on which a particular application is installed. The following information is available on this screen when you navigate to APM > Dashboard > Infrastructure.
The Infrastructure screen displays the following columns in a table format.
| Field | Description |
|---|---|
| Name | Name of the instance. |
| CPU usage (%) | Percentage of CPU currently utilized by the instance. |
| RAM available (%) | Percentage of available (free) RAM on the instance. |
| Storage available (%) | Percentage of available storage capacity on the instance. |
| Network bandwidth usage (KB/s) | Amount of network bandwidth being used by the instance, measured in kilobytes per second. |
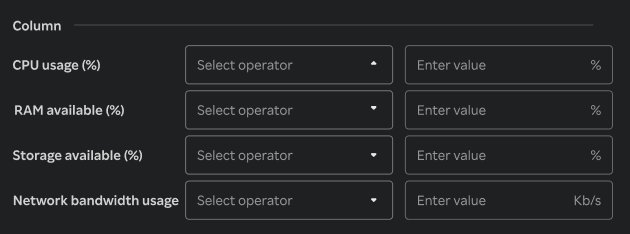
Multi-column Filter
- Multi-column filter can be applied on numeric columns within the Infrastructure Table to refine the displayed data based on specific conditions.
- When the user clicks on the “Filter by” option, user can apply filter below numeric columns
| Field | Description |
|---|---|
| Name | Name of the instance. |
| CPU usage (%) | Percentage of CPU currently utilized by the instance. |
| RAM available (%) | Percentage of available (free) RAM on the instance. |
| Storage available (%) | Percentage of available storage capacity on the instance. |
| Network bandwidth usage (KB/s) | Amount of network bandwidth being used by the instance, measured in kilobytes per second. |
- Each filter condition is applied using the below operators and value ( user input based on the unit)
| Operator |
|---|
| Greater than |
| Less than |
| Equals |
| Greater than or equals |
| Less than or equals |
- Once filters & conditions are applied save button is enabled & click "Save" to apply the filter.
- Once filters & conditions are applied it displays no. of filters are applied.
note
- Filters are applied using AND logic — all specified conditions must be met for a record to be displayed.
- Only numeric columns support filtering; non-numeric fields (e.g., text or categorical values) are excluded from the filter options.
- If no records match the selected filters, the table will display a message such as “No data".
- The multi-column filter state persists until the user clears filters by clicking on "Clear" button when Filter by button is clicked.
- A "Reset" button is available to clear all applied filters and restore the table to its original, unfiltered state. This button is enabled only when one or more filters are currently applied.
Downloading a report
Click the to download upto 10000 unique rows in the report in csv format.