Database Custom Queries
Role: Standard Operation Environment, SREs (Site Reliability Engineers), and DB Administrator.
As a database user or developer, you can write database queries so that you can access and manipulate data which a standard query may not support.
You can write a custom query to execute on a database so that you can get a metric after execution.
The following databases are supported.
- MySQL
- MsSQL
- PostgreSQL
- Navigate to Settings on the left pane from the SixthSense Observability portal page.
- Click the DB custom query tab.
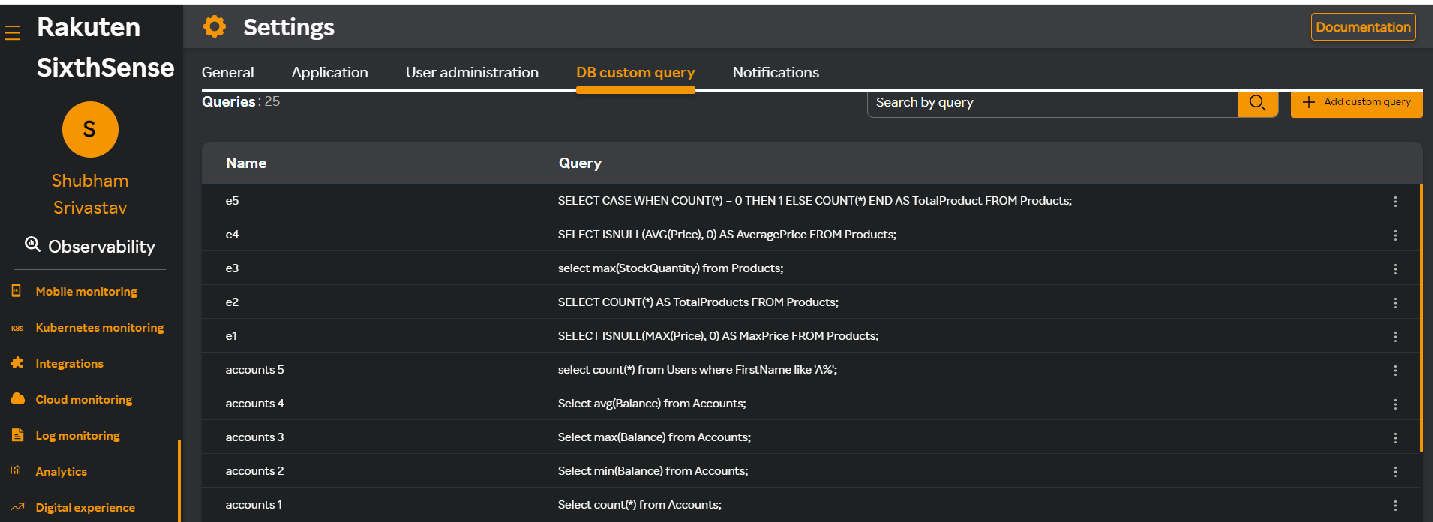
A DB custom query screen similar to the following appears.

This screen lists the existing database queries already added along with its name. For more information about adding custom queries, see Adding custom queries
For more information about managing these queries, see Managing custom queries.
Adding custom queries
- Navigate to Settings on the left pane from the SixthSense Observability portal page.
- Click the DB custom query tab.
- Click + Add custom query.
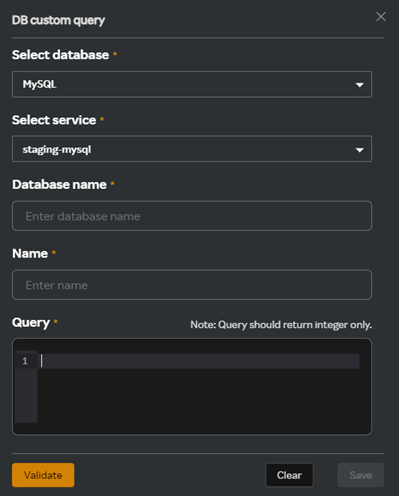
The following DB custom query window appears.

- Fill in the following fields.
| Field | Description |
|---|---|
| Select database | Select a database type that you want to query on from the drop-down list. MySQL, MsSQL, and PostgresSQL databases are supported. |
| Select service | Select a database service available from the drop-down list. |
| Database name | Enter a database name. |
| Name | Enter a new custom query name. |
| Query | Enter a custom query in the query box which must return and integrer only. |
- Click Validate to validate the query.
- Click Save to save the query.
Managing custom queries
- Navigate to Settings on the left pane from the SixthSense Observability portal page.
- Click the DB custom query tab.
- Click the
 icon next to any of the existing custom query in the DB custom query screen.
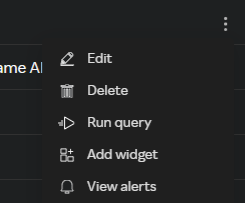
The following options appear.

- Select any of the options, to edit, delete, run a query, add widget, and view alerts for a selected query.
Editing a query
- Click the Edit option from the drop-down list.
- In the DB custom query window, do the following:
- Edit the query in the Query box.
- Click Validate.
- Click Update.
Deleting a query
- Click the Delete option from the drop-down list. A confirmtion message appears to confirm deletion.
- Click Delete to confirm deleting the metric.
note
Alerts configured for this metric will be deleted and the corresponding widget will have no data.
Running a query
- Click the Run query option from the drop-down list.
- Click Validate the validate the query in the Query box.
- Click Run to run the query.
Adding a widget
- Click the Add widget option from the drop-down list. You will see a table with the message and timestamp displayed.
- Click the
 icon against a message to expand the query and copy it.
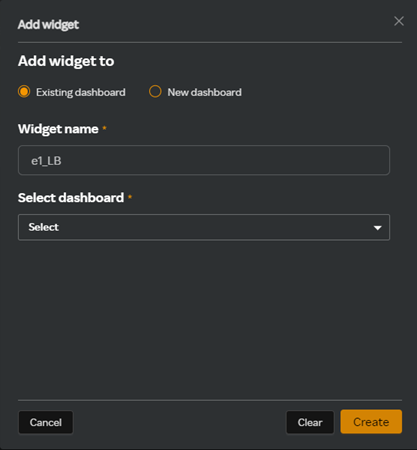
 - Click either the Line graph or Label from the Add widget pane on the right. The Add widget window appears.

- Enter the following details if you want to add a widget to an existing dashboard.
| Field | Description |
|---|---|
| Existing dashboard | Select this radio button to add the widget to an existing dashboard |
| Widget name | Enter a name for the widget. |
| Select dashboard | Select an existing dashboard. |
OR
Enter the following details if you want to add a widget to a new dashboard.
| Field | Description |
|---|---|
| New dashboard | Select this radio button to add the widget to a new dashboard |
| Widget name | Enter a name for the widget. |
| Dashboard name | Name for the dashboard you want to create. |
| Copy template | Allows you to select an existing dashboard template. |
- Click Create.
Viewing alerts
- Click the View alerts option from the drop-down list. The list of open alerts for the application are displayed.
note
If there are no open alerts, you can either go to the Configured alerts tab to update existing alerts, or click Add alert to add alerts.