Analytics alerts
Configure Analytics alerts so that you can be notified of issues based on the metrics and threshold values you set.
The following procedure allows you to set alerts for Analytics.
- Navigate to Analytics on the left pane in the Observability portal.
- Click the View saved searches tab.
- Click View alerts against the saved search row. The Alerts page appears.
note
Alerts are available only for metric and not for table type.
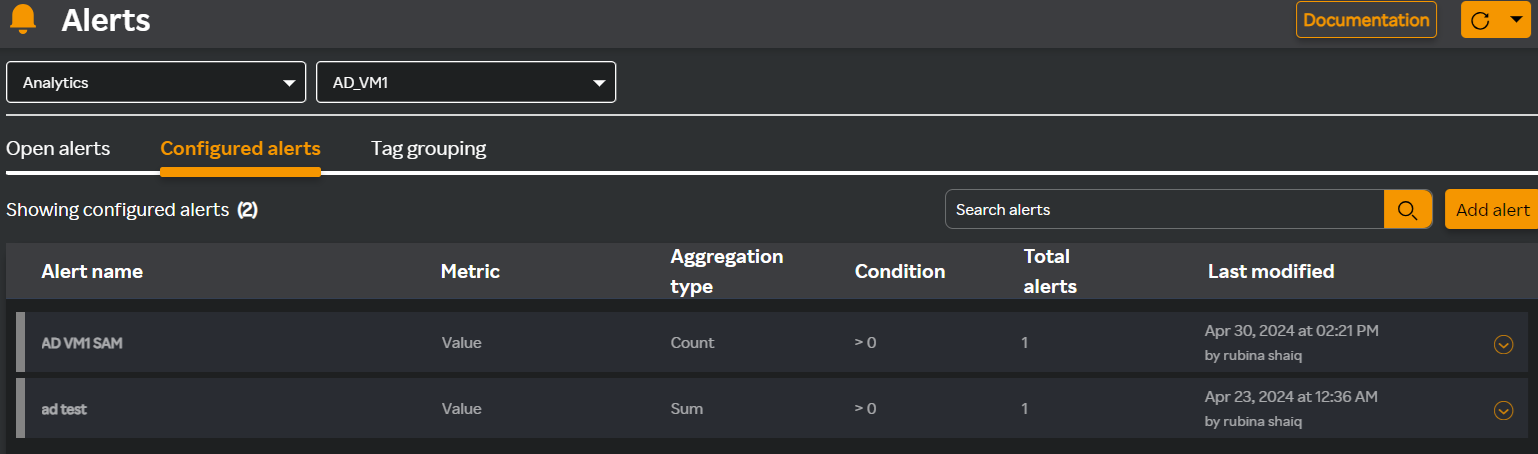
- Click the Configured alerts tab. The Analytics capability is selected by default in the Search capability drop-down list.
- Select the saved search query from the Search service drop-down list to view configured alerts. A screen similar to the following appears with configured alerts.
- Click the
 icon against the alert row to view the alert details.
note
You can activate/inactivate an alert, edit, and delete an alert from the Status and Action columns.
- Click Add alert to add an alert.
The following Add alert window appears.
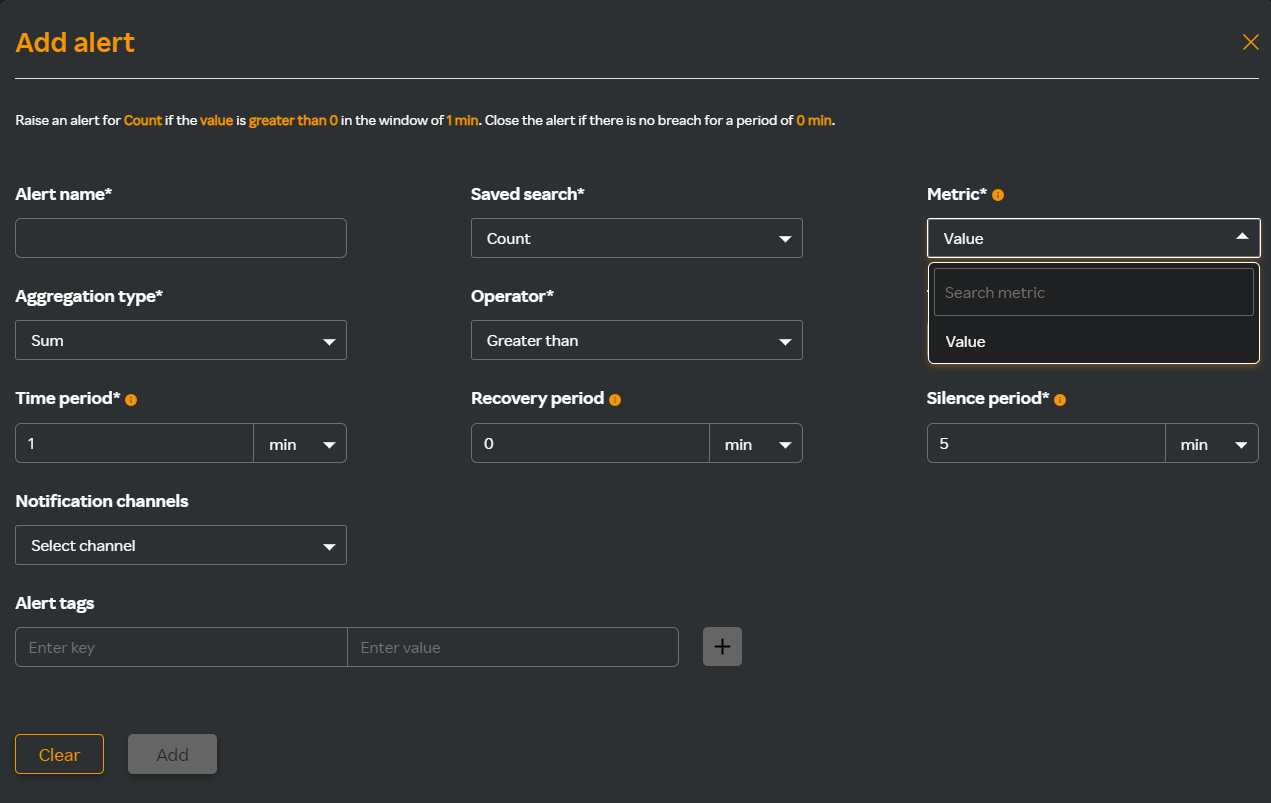
- In the Add alert window fill in the following details:
| Field | Description |
|---|---|
| Alert name | Name of the alert. Note that only alphanumeric and a single space between words are allowed. |
| Saved search | List of available saved search you have created. |
| Metric | The metric for which you want to trigger an alert. The threshold is matched with the metric's real-time value. For more information about the supported metrics for each capability, see Supported metrics for alerts. Note: The following fields are displayed based on the metrics you have selected. |
| Aggregation type | The options available for this drop-down are based on the metric you select in the Metric drop-down list. For the available options, see Aggregation type options. |
| Operator | Select greater or lesser than, equal to, greater than or equal to, or lesser than or equal to. |
| Threshold value | Select a threshold value. Alerts are triggered if the value over the given period is greater than or equal to the threshold you select. |
| Time period | The length of time for which the alert is evaluated. Note: When there is a latency between the agent and backend communications, alerts configured for one minute may have some accuracy issues. |
| Recovery period | An open alert is marked as closed if there are no new breaches after it reaches the specified period |
| Silence period | The time during which alerts are not triggered. |
| Notification channels | The list of configured notification channels. You can select multiple notification channels that are available. If you haven't added a notification channel yet, click Create new channel. For more informaiton about adding notification channels, see step 4 for adding an email notification channel, or see step 4 for adding a slack channel, or see step 4 for adding a webhook notification channel. |
| Alert tags | Enter a key and value for an alert tag. The best practice for naming a key would be the capability name followed by the application name at the backend. For example, Analytics-Count where Analytics is the capability name and Count is the service name. The value would be the name of the metrics followed by the capability. For example value-LM, where value is the metrics and Analytics is the capability name. |
- Click Add.