Couchbase
Use the following procedure for monitoring the Couchbase database.
- Navigate to Database monitoring on the left pane.
- Select Couchbase from the Select database drop-down list.
- Select the cluster from the Select cluster drop-down list.
The following screen appears along with the various available tabs.
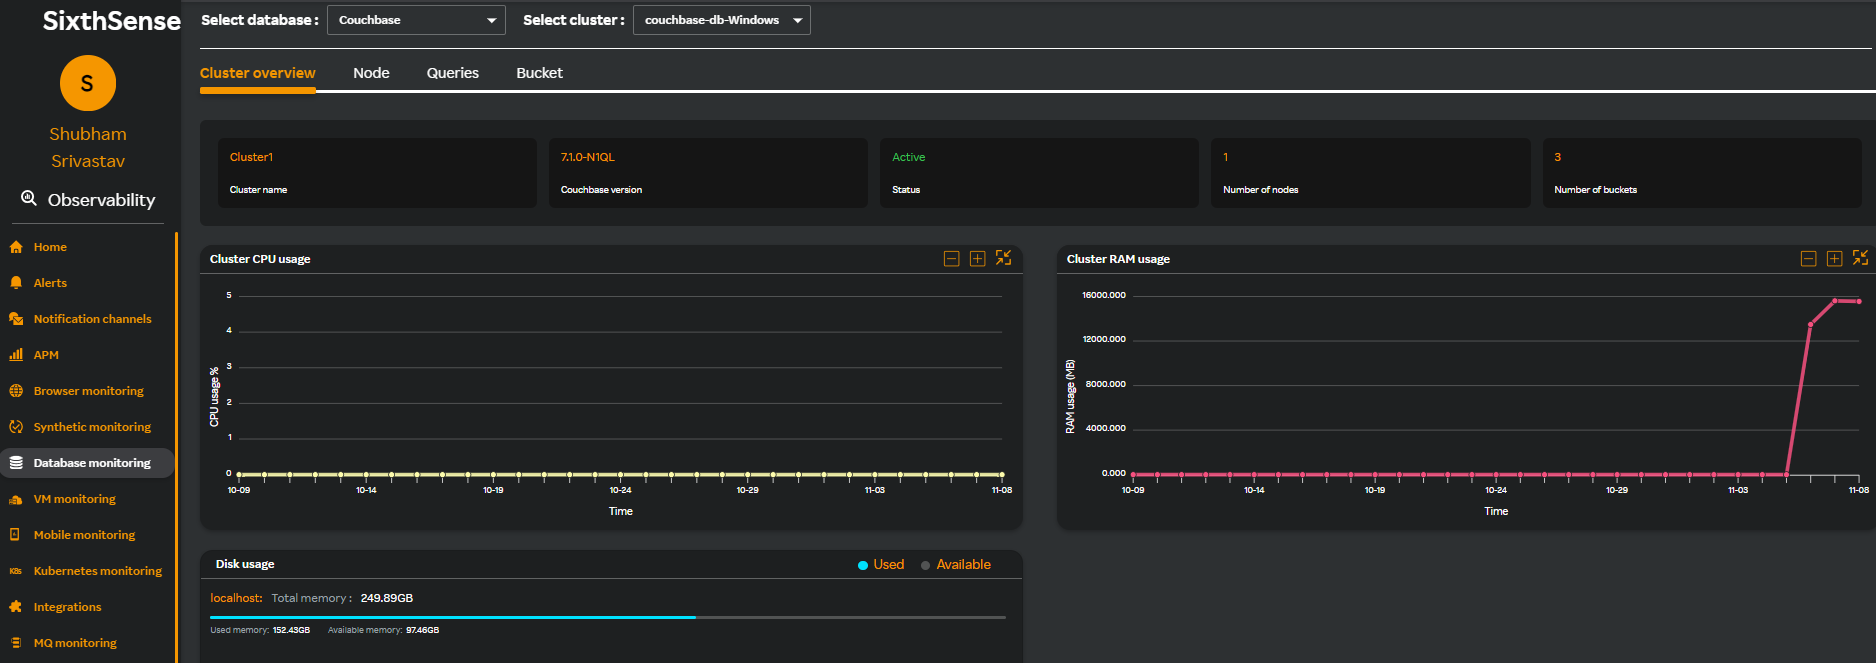
Cluster Overview
The Cluster Overview tab is selected by default. The following metrics are displayed in graph format.
| Metric Name | Description |
|---|---|
| Cluster CPU usage | CPU utilization of cluster |
| Cluster RAM usage | Memory utilization of cluster |
| Disk usage | Disk usage of cluster |
| DB up time | Availability and uptime of the cluster |
| DB down time | Any period during which a cluster is unavailable or inaccessible |
Node
Clicking the Node tab displays the following metrics.
| Metric Name | Description |
|---|---|
| CPU usage | CPU utilization of node |
| RAM usage | Memory utilization of node |
| Disk usage | Disk usage of cluster node |
| Swap memory | Amount of swap space used |
| Node operations | Includes ops, number of hits and cmd get |
| Current items | Number of current items at node level |
| Node replica | Number of node replicas |
| Docs data size | |
| MCD memory | The allocated MCD memory |
Queries
Clicking the Queries tab displays the following metrics.
| Metric Name | Description |
|---|---|
| Requests | Number of request per node |
| Request time distribution | Request mean, median, 95 percentile, and 99 percentile |
| Request thread count | Number of request thread counts |
| GC count | Garbage collection count |
Select the threshold from the Query threshold drop-down list.
The following screen is displayed with the query details.
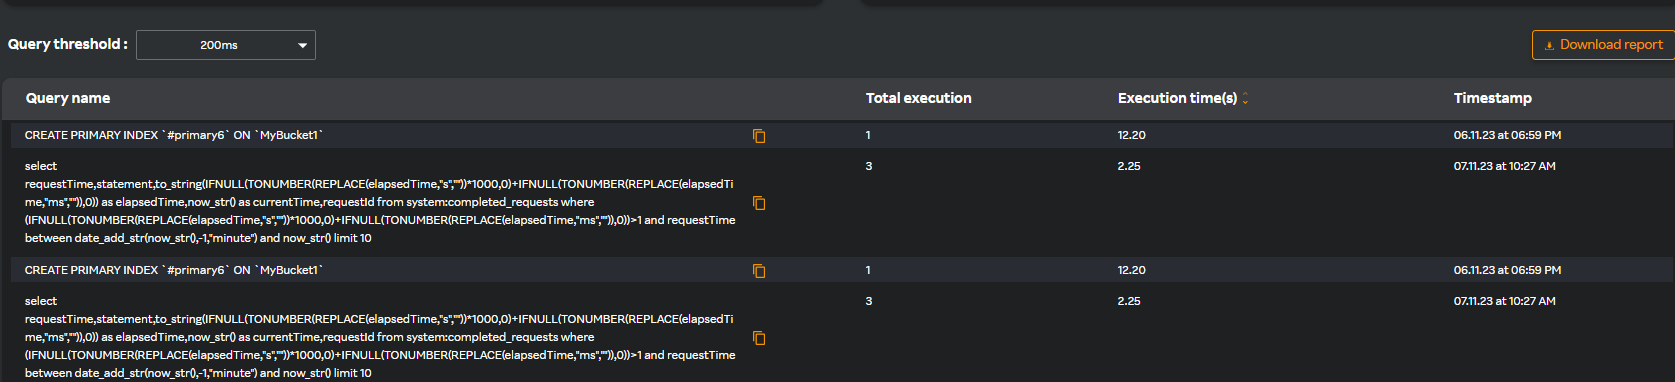
note
You can download the report in PDF format by clicking Download report.
Bucket
Enter the name of a bucket in the Search bucket drop-down list. The following metrics are displayed.
| Metric Name | Description |
|---|---|
| Bucket ops | Bucket operations |
| Disk used | Bucket disk used |
| Mem used | Bucket memory used |
| Current items | Bucket current items |
| Database time | The expiry duration of documents within a bucket |
Metrics
| Metric Name | Description |
|---|---|
| Active connections | Refers to the number of client connections to the Couchbase cluster. |
| Failed connections | Refers to a client initiated request to connect to a server failed. |
| Total transactions | Provides a summary count of completed operations. |
| Average transaction rate | Quantifies the average number of transactions processed by a system per unit of time. It's a measure of system throughput and efficiency. |
| Events processed per second | It is related to the Eventing Service, which explicitly processes document mutation events. |
| Average execution time per event (ms) | This metric measures the average duration that a single Couchbase Eventing Function takes to complete its execution from the moment it is triggered by a document mutation until it finishes processing. |
| Total mutations | represents the cumulative sum of all operations that result in a change to the data stored within a Couchbase bucket or across the entire cluster. This metric quantifies the total write activity over a given period. |
| Failed event count | Represents the cumulative number of times a Couchbase Eventing Function failed to successfully process a document mutation (event). When an Eventing Function encounters an unhandled error during its execution, or if it explicitly throws an exception that isn't caught, it increments this counter. |
| Eventing on update failure | It tracks instances where an Eventing Function attempts to perform an update operation on a document within Couchbase itself as part of its logic, and that particular update operation fails. |
| Eventing on delete failure | It tracks instances where an Eventing Function attempts to perform a delete operation on a document within Couchbase itself as part of its logic, and that particular delete operation fails. |
| Eventing worker restart count | Measures the cumulative number of times an Eventing worker process has unexpectedly terminated and subsequently restarted on an Eventing node. |
| Worker thread utilization | Describes the percentage of time that worker threads within a system are actively engaged in processing tasks, as opposed to being idle or waiting. It's a key indicator of how efficiently a system's concurrent processing capabilities are being used. |
| Eventing memory usage | Quantifies the amount of Random Access Memory (RAM) currently being consumed by the Couchbase Eventing Service and its associated worker processes on an Eventing node. |
| Timer execution count | Represents the cumulative number of times an Eventing Timer has successfully "fired" and triggered the execution of its associated Eventing Function. |
| System log errors | Accumulates the number of log entries that have a severity level of "ERROR" or above (e.g., FATAL, CRITICAL, ALERT, EMERGENCY, although "ERROR" is the most common highest level for operational issues). |
| Cache hit ratio | Represents the percentage of document read requests that were successfully retrieved directly from the Couchbase Data Service's in-memory cache (the managed cache), without needing to access the underlying disk. |
| Disk read bytes | Accumulates the total number of bytes that the system (or a specific process/application) has requested and successfully received from physical disk devices (HDDs, SSDs, NVMe drives) |
| Disk write bytes | Accumulates the total number of bytes that the system has sent and successfully committed to physical disk devices. |
| Log monitoring | Log monitoring involves the systematic collection, parsing, analysis, and alerting on events recorded in Couchbase's log files. |
Security
| Metric Name | Description |
|---|---|
| Failed logins | Counts each instance where a user (human or application service account) attempts to connect to and authenticate with the Couchbase cluster, but the authentication process fails. |
| Delete operations | Counts each successful invocation of a delete operation on a document within a Couchbase bucket. When an application or a Couchbase internal process (like expiration) removes a document, this metric is incremented. |
| DML operations | Quantifies the total number of operations performed that modify the data stored within a database. It specifically refers to the set of commands or actions used to manipulate the data. |
| Auth failed count | Increments every time a client tries to establish a connection or perform an operation requiring authentication, but the authentication process fails. |
| Auth success count | Increments every time a client successfully authenticates with the Couchbase cluster. This means the provided credentials are valid, and the client has been granted access. |
Service
| Metric Name | Description |
|---|---|
| XDCR throughput | Measures the number of documents or the total bytes of data that are successfully replicated from the source cluster to the target cluster per unit of time. It provides an indication of the speed and efficiency of the data synchronization process. |
| XDCR latency | Measures the time difference, typically in milliseconds or seconds, for a change to propagate from one cluster to another. It's a critical indicator of how "fresh" the data on the target cluster is relative to the source. |
| XDCR replication queue size | Measures the size of the internal queue within the XDCR pipeline. When a document mutation occurs on the source cluster, it's added to this queue to await transmission and application on the target cluster. |
| XDCR bandwidth usage | Measures the actual amount of network bandwidth being consumed by the XDCR process. |
| XDCR data replicated | This metric is a cumulative counter. Each time a document mutation is successfully applied to the target cluster as a result of XDCR, the size of that document is added to this metric. |
| XDCR pipeline errors | A counter that increments each time a document or a batch of documents fails to replicate through the XDCR pipeline due to an error. |
| XDCR active replications | Counts the number of configured XDCR replication streams that are in a "running" or "active" state. An active replication means that the XDCR process is attempting to detect changes on the source cluster and propagate them to the target cluster. |
| DCP connections | Counts how many entities are currently connected to a specific Data Service node via DCP to receive a continuous stream of mutations. |
| DCP buffer ratio | Represents the percentage of the allocated DCP buffer space that is currently being used. |
| DCP back off | Measures the cumulative time (in milliseconds or seconds) that the DCP stream has been paused or backed off due to these flow control mechanisms over a given period. |
| DCP flow control buffer usage | Measures the current fill level of this buffer. It is paramount for maintaining the performance and stability of your Couchbase cluster. |
| DCP mutation rate | Measures the number of individual document mutations that a specific Data Service node is sending out over its DCP streams per second. It reflects the output rate of the DCP pipeline from that node. |
Multi-column Filter
Queries
- Multi-column filter can be applied on numeric columns within the Queries Table to refine the displayed data based on specific conditions.
- When the user clicks on the “Filter by” option, user can apply filter below numeric columns
| Column Name | Description |
|---|---|
| Total execution | Total number of query executions recorded. |
| Maximum execution time (s) | The longest query execution time recorded in seconds. |
| Maximum execution timestamp | Date and time when the longest-running query was recorded. |
- Each filter condition is applied using the below operators and value ( user input based on the unit)
| Operator |
|---|
| Greater than |
| Less than |
| Equals |
| Greater than or equals |
| Less than or equals |
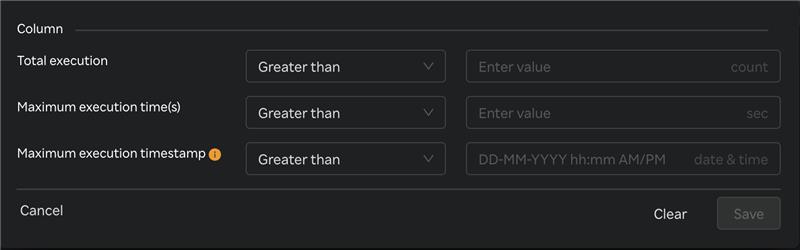
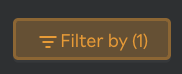
- Once filters & conditions are applied save button is enabled & click "Save" to apply the filter.
- Once filters & conditions are applied it displays no. of filters are applied.
note
- Filters are applied using AND logic — all specified conditions must be met for a record to be displayed.
- Only numeric columns support filtering; non-numeric fields (e.g., text or categorical values) are excluded from the filter options.
- When the Maximum Execution Timestamp (s) filter is applied, the system reviews each query in the table. If a query was executed within the time frame selected in the top-right corner, it displays that query’s maximum execution timestamp and maximum execution time.
- If no records match the selected filters, the table will display a message such as “No data".
- The multi-column filter state persists until the user clears filters by clicking on "Clear" button when Filter by button is clicked.
- A "Reset" button is available to clear all applied filters and restore the table to its original, unfiltered state. This button is enabled only when one or more filters are currently applied.
