Ingesting Prometheus metrics
The following procedure allows you to ingest Prometheus metrics into SixthSense AO using the Analytics capability.
Prerequisites
- Windows VM Agent must be installed. This agent runs the PowerShell script that extracts Prometheus data.
- PowerShell script is included in this page.
- Prometheus URL from which metrics will be extracted.
- Steps to ingest Prometheus metrics into AO.
- Save the PowerShell script below and add the required Prometheus URL on line 4.
[CmdletBinding()]
# Define the Prometheus endpoint URL
$PrometheusEndpoint = "<prometheus_url>" # Base URL, not the /query endpoint
try {
# 0. Set TLS version
[Net.ServicePointManager]::SecurityProtocol = [Net.SecurityProtocolType]::Tls12
# 1. Get the list of all metric names from /api/v1/metadata
$metadataUri = "$PrometheusEndpoint/api/v1/metadata"
Write-Verbose "Getting metric metadata from: $metadataUri"
try {
# Check for proxy settings and bypass if necessary
if ($PSBoundParameters.ContainsKey("Proxy")) {
Write-Verbose "Using proxy: $($PSBoundParameters.Proxy)"
$metadataResponse = Invoke-WebRequest -Uri $metadataUri -UseBasicParsing -Proxy $PSBoundParameters.Proxy -ErrorAction Stop
} else {
Write-Verbose "No proxy specified, checking system proxy settings"
# Check if a system proxy is configured
$proxy = Get-ItemProperty -Path 'HKCU:\Software\Microsoft\Windows\CurrentVersion\Internet Settings' | Select-Object -ExpandProperty ProxyEnable
if ($proxy -eq 1) {
Write-Warning "System proxy detected. Consider explicitly setting the -Proxy parameter if you encounter issues."
}
$metadataResponse = Invoke-WebRequest -Uri $metadataUri -UseBasicParsing -ErrorAction Stop
}
Write-Verbose "Metadata retrieval successful. Raw content: $($metadataResponse.Content)" # Output raw content
$metadataJson = ConvertFrom-Json -InputObject $metadataResponse.Content
Write-Verbose "Metadata retrieval successful. Status: $($metadataJson.status)"
}
catch {
Write-Error "Error getting metric metadata: $($_.Exception.Message)"
throw "Error getting metric metadata: $($_.Exception.Message)"
}
if ($metadataJson -eq $null) {
Write-Error "Metadata JSON is null!"
throw "Metadata JSON is null!"
}
if ($metadataJson.status -ne "success") {
Write-Error "Metadata retrieval failed. Error: $($metadataJson.error)"
throw "Error getting metric metadata: $($metadataJson.error)"
}
if (-not $metadataJson.data) {
Write-Error "Metadata data is empty!"
throw "Metadata data is empty!"
}
# 2. Create a custom object to store the results
$results = [PSCustomObject]@{
HostName = $env:COMPUTERNAME
Timestamp = Get-Date -Format "yyyy-MM-dd HH:mm:ss"
Source = "Prometheus.ps1"
}
# 3. Loop through each metric name and query its value
# Use a different way to access the keys
foreach ($metricName in $metadataJson.data.PSObject.Properties.Name) {
# Skip internal metrics (starting with a double underscore)
if ($metricName -like "__*") {
continue
}
# Construct the query for the current metric
$query = "$metricName" # Simple query: just the metric name
# Construct the full URI for the query
$queryUri = "$PrometheusEndpoint/api/v1/query?query=" + [System.Uri]::EscapeDataString($query)
Write-Verbose "Querying metric '$metricName' with URI: $queryUri"
try {
$queryResponse = Invoke-WebRequest -Uri $queryUri -UseBasicParsing -ErrorAction Stop
$queryJson = ConvertFrom-Json -InputObject $queryResponse.Content
Write-Verbose "Query for metric '$metricName' successful. Status: $($queryJson.status)"
}
catch {
Write-Error "Error querying metric '$metricName': $($_.Exception.Message)"
continue # Move to the next metric
}
if ($queryJson.status -eq "success" -and $queryJson.data.result.Count -gt 0) {
# Extract the value
$metricValue = $queryJson.data.result[0].value[1]
# Add the metric to the results object
Add-Member -InputObject $results -MemberType NoteProperty -Name $metricName -Value $metricValue
Write-Verbose "Successfully added metric '$metricName' with value '$metricValue'"
} else {
# Suppress the warning message
# Write-Warning "Metric '$metricName' not found or error in query"
}
}
# Add Error property after loop
$results | Add-Member -MemberType NoteProperty -Name "Error" -Value $null
# Convert to JSON and output
$results | ConvertTo-Json
} catch {
# General error handling
$results = [PSCustomObject]@{
HostName = $env:COMPUTERNAME
Timestamp = Get-Date -Format "yyyy-MM-dd HH:mm:ss"
Source = "Prometheus.ps1"
Error = $_.Exception.Message
}
$results | ConvertTo-Json
}
Installation
- Save the PowerShell script on the Windows system that is being monitored by the Windows Infra Agent. You will require the path of the PowerShell script.
- In the Windows VM agent directory, make changes in the conf/executions_config.yaml file. Add the following:
- the backend http collector url for logs
- access token
- service name (can be anything) and script path
sixthsensescheduler:
name: Script_Monitoring
enabled: true
sixthsense_scheduler_backend: https://http-collector-observability.sixthsense.rakuten.com/log/v1/log
secure: true
access_token: <access token from the UI>
logging: debug
cronCycle: "*/1 * * * *"
runAllScriptsParallel: true
# ----------- Execution task configuration -- --------------
scripts:
- type: powershell
service_name: prometheusService
enabled: true
timeout: 30
script_path:
- 'path/to/powershell/script.ps1
- Once the changes are saved on both the PowerShell script and executions_config, you must start/restart the Windows VM agent.
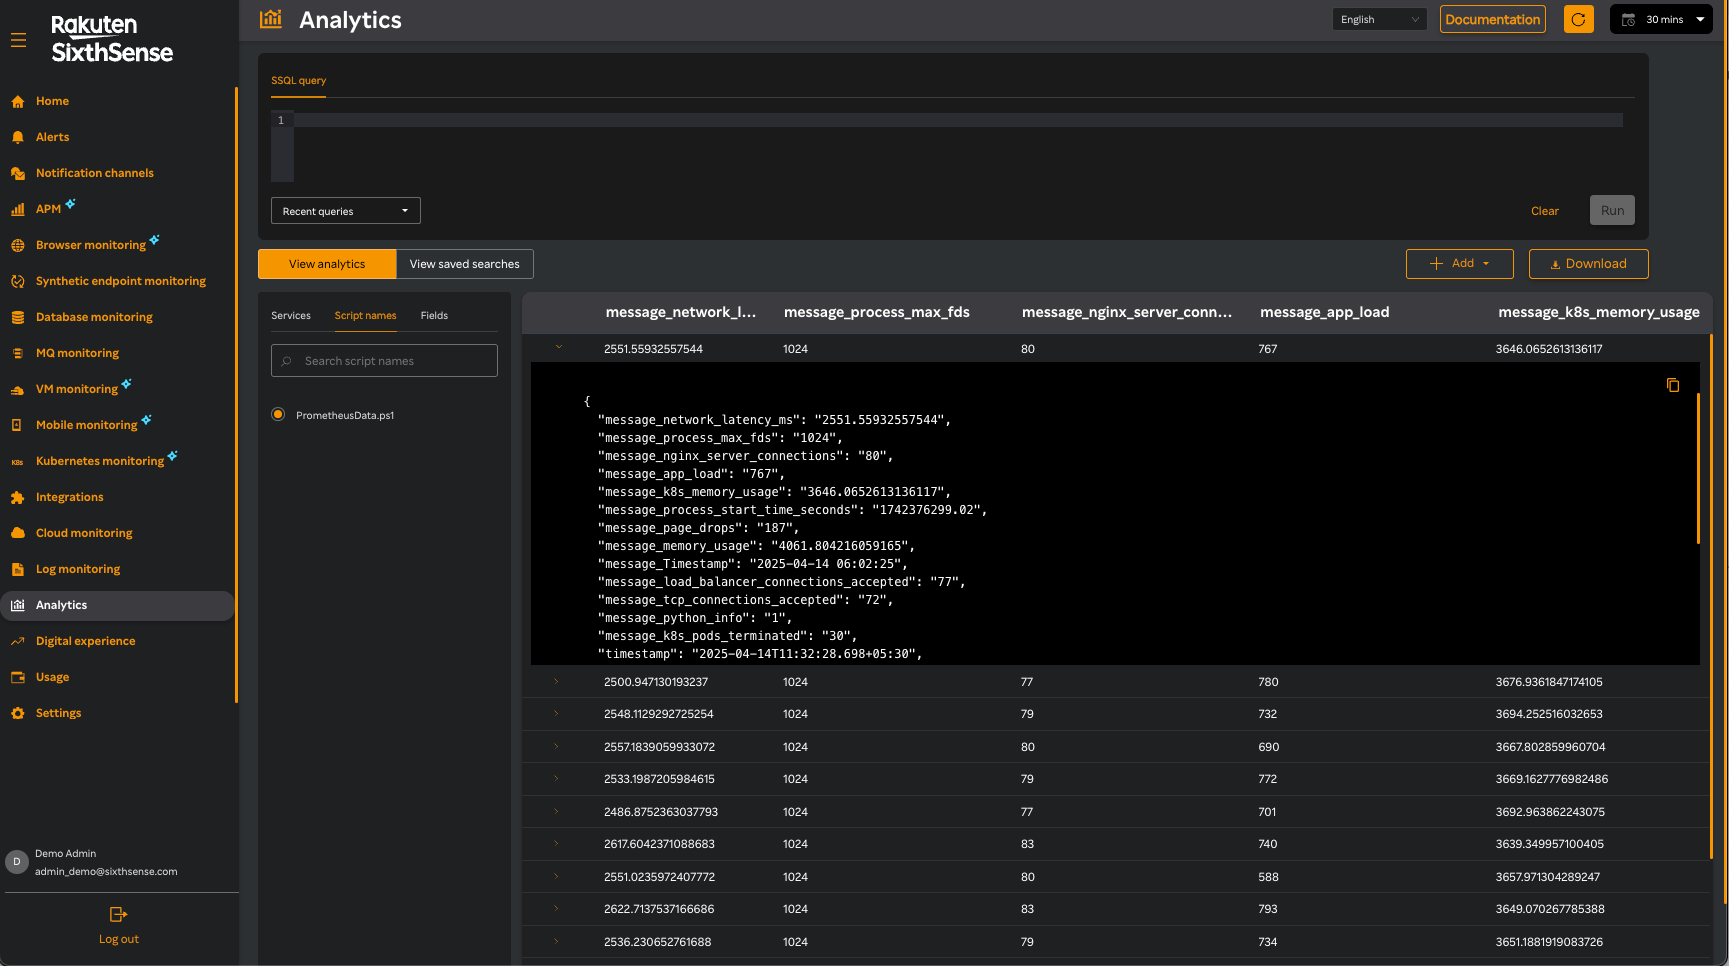
Viewing on the dashboard
The agent reports the Prometheus metric data as a json entry, in the analytics capability. Refer to the following screen.
Queries can be created on this data using the query and custom dashboard capability. Refer to the following screen.
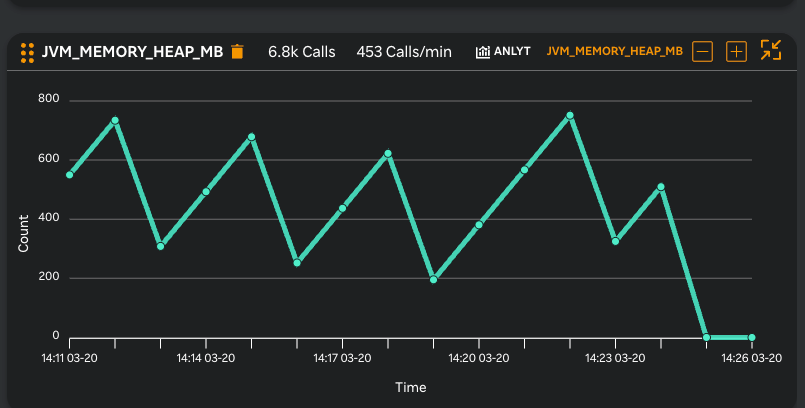
Prometheus data on AO through Analytics (in MB)