Managing Dashboards
Once you login to the Observability portal, you can view the standard dashboard. If the applications you want to monitor are already configured, you can view them in the standard dashboard.
Common features that you can use in the dashboard are:
| Feature | Description |
|---|---|
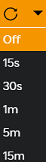 | OFF: By default, the option is set to OFF. You can toggle the switch to switch it ON/OFF. ON: You can switch ON this option to automatically refresh the dashboard. Once you switch it ON, you can set the interval to refresh the dashboard. |
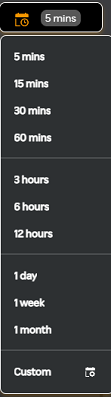 | Using the calendar icon, you can set the duration for monitoring applications in minutes, hours, days, today, yesterday, weeks or months. |
 | You can create your own customized dashboard. To understand the procedure to add a new dashboard, refer to Adding a dashboard. |
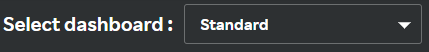 | This is a pre-configured dashboard that appears by default.Click the Standard drop-down list and search for a dashboard or enter the name to search for a dashboard. |
 | Once you click the Make default check box, the selected dashboard is set as a default home page for your profile. |
Adding a Dashboard
Customize your dashboard so that you can view data from all relevant capabilities into a single dashboard and not just everything. You can drill down to the required information and make informed decisions quickly. To add dashboards, perform the following procedure.
- Click Add dashboard in the home screen.
The following screen appears.
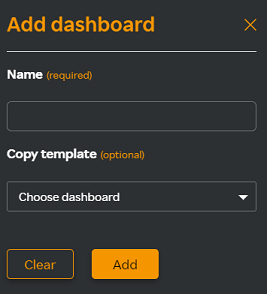
- Enter a unique name to identify the dashboard in the Name field.
- (Optional) You can select any existing template from the Copy template drop-down list. All the widgets that were added to the selected dashboard gets copied to the new dashboard.
note
If you do not select an existing dashboard, a blank dashboard gets created.
- Click Add.
tip
After creating a blank dashboard, you can add a widget to the dashboard. For more information about adding a widget, see Adding a Widget.
Adding a Widget
A widget is a software component that you can plugin with SixthSense application to track and monitor an application and collect the required statistics.
Use the following procedure to add a widget.
- Click Add widget
- Enter a name to identify the widget in the Name field.
- Select either of the following options from the Capability drop-down menu.
- Select APM to monitor an application.
- Select Browser monitoring to monitor the browser statistics.
- Select Mobile monitoring to monitor the mobile application.
- Select Log monitoring to monitor the logs.
- Select the available applications that are already configured from the Application drop-down list.
- Select any of the following options from the Metric drop-down menu:
If you have selected APM in the Capability field, the following options are available:
- Load: Add load related metrics that you want to monitor.
- Error: Add error related metrics that you want to monitor.
- Response time: Add response time metrics that you want to monitor.
If you have selected Browser monitoring in the Capability field, the following options are available:
- Load: Add load related metrics that you want to monitor.
- Load time: Add load time related metrics that you want to monitor.
- Error: Add error metrics that you want to monitor.
If you have selected Mobile monitoring in the Capability field, the following options are available:
- Application summary
- Number of Crashes
- Crash Affected Users
- Crashes By OS
- Crashes By app Version
- Crashes By device (Top 5)
- Number Of Requests
- HTTP Response Time
- Error Rate
- Users Impacted by Errors
- Active Sessions
- App Launches
- New Users
- Usage By OS
- Usage By device (Top 5)
- App Version Distribution (Top 4)
If you have selected Log monitoring in the Capability field, click Go to LM which will take you to the Log monitoring page.
- Click Add. The widget with corresponding capabilities and metrics are added to your dashboard.
Working with a Widget
After you add a widget to your dashboard, you can work with the widget using the following options:
| Icons | Description |
|---|---|
| Click this icon to view an application. | |
| Click this icon to expand the timeline. | |
| Click this icon to contract the timeline. | |
 | Click this icon to reset the view to the default timeline. |
note
You can delete a widget and add a new one, but you cannot edit a widget.
Editing a Dashboard
Edit a dashboard name using the following procedure.
- Go to the Select dashboard drop-down list from the Observability portal's home page. The following screen appears.
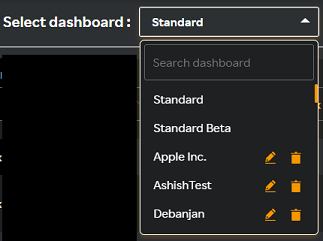
- Click the
 icon next to the dashboard you want to edit.
The following screen appears.
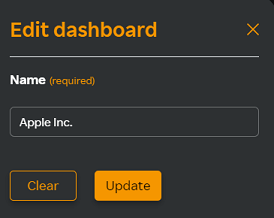
- Edit the Name field.
- Click Update.
note
The dashboard name field supports a maximum of 20 characters.
Searching a Dashboard
Search for dashboards that you have created using the following procedure.
- Go to the Select dashboard drop-down list from the portal.
- Enter the name of dashboard in the Search dashboard field. The dashboard list scrolls to the dashboard you are searching for.
Deleting a Dashboard
Delete a dashboard that you have created using the following procedure.
- Click the Select dashboard drop-down list.
The following screen appears.
- Scroll down to the dashboard you want to delete.
- Click the
 icon next to the dashboard name.
 - Click Delete in the Delete dashboard window.