MsSQL
Use the following procedure for monitoring the MsSQL database.
- Navigate to Database monitoring on the left pane.
- Select MsSQL from the Select database drop-down list.
- Select a service from the Select service drop-down list.
- Select a database from the Select database drop-down list.
A screen similar to the following appears along with the various available tabs.
The cluster information is displayed in the Cluster Info pane at the top of the screeen.
Hardware
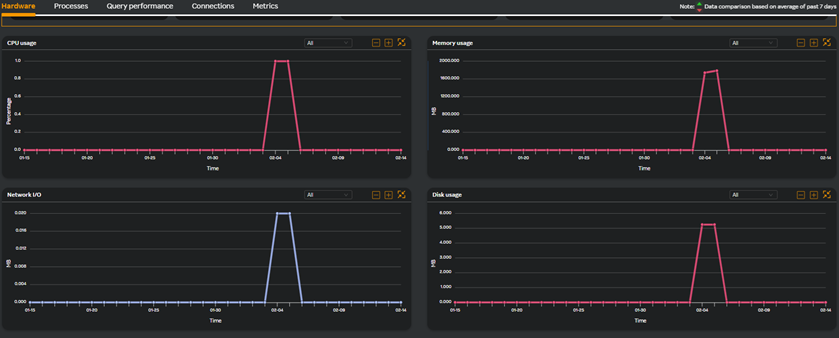
The Hardware tab is selected by default. A screen similar to the following appears.
The following widgets are displayed.
| Metric Name | Description |
|---|---|
| CPU usage | Refers to the amount of processing power consumed by the database server while executing queries, performing transactions, and managing system operations. High CPU usage indicates performance bottlenecks in the database. Monitoring identifies processes consuming excess CPU resources, pinpoint inefficient queries that may need optimization and so on. It is essential for maintaining optimal performance, ensuring resource efficiency, troubleshooting issues, and enhancing user experience. |
| Memory usage | Refers to the amount of system memory (RAM) utilized by the database management system (DBMS) for various operations, including caching data, managing connections, and executing queries. Monitoring the memory usage is essential for maintaining optimal performance, ensuring resource efficiency, troubleshooting issues, and enhancing user experience. By implementing effective monitoring practices, database administrators can proactively manage their SQL Server instances and ensure they meet both current and future demands. |
| Network I/O | Refers to the amount of data transmitted between the database server and client applications or other servers over a network. This metric ensures that database administrators can detect network-related performance issues early, take proactive steps to optimize resource utilization, and maintain a high-performance SQL Server environment. |
| Disk usage | Refers to the amount of disk space consumed by the database files, including data files, log files, and index files. This is essential for maintaining optimal performance, ensuring resource efficiency, troubleshooting issues, and enhancing data integrity. Database administrators can proactively manage their SQL Server instances and ensure they meet both current and future demands. |
| Total bytes read | Refers to the cumulative amount of data that has been read from disk or memory by the database management system (DBMS). Database administrators can gain a clearer picture of database I/O activity, identify inefficient queries, and ensure optimal performance of the SQL Server instance. |
| Total bytes write | Refers to the cumulative amount of data that has been written to disk by the database management system (DBMS). It is crucial for maintaining optimal performance, ensuring resource efficiency, troubleshooting issues, and enhance data integrity. By implementing effective monitoring practices, database administrators can proactively manage their SQL Server instances and ensure they meet both current and future demands. |
Processes
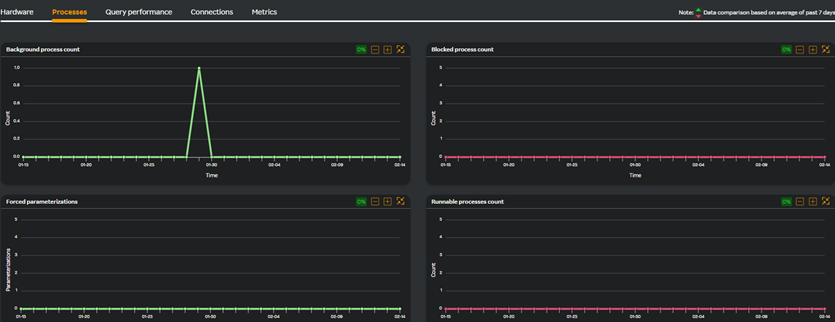
A screen similar to the following appears when you select the Processes tab.
| Metric Name | Description |
|---|---|
| Background process count | This widget is a graph widget which displays the count of background processes of the selected node. Database administrators gain a comprehensive view of internal activities, troubleshoot performance issues, and maintain a stable and well-performing SQL Server environment. |
| Blocked processes count | This widget is a graph widget which displays the number of blocked processes of the selected node. It ensures you can identify, diagnose, and remediate latency issues caused by resource conflicts, thereby maintaining a responsive and efficient database environment. |
| Forced parameterizations | This widget is a graph widget which displays the forced parameterizations of the selected node. By regularly monitoring forced parameterization, database administrators can fine-tune settings to maximize query performance, minimize unnecessary compilations, and effectively balance the benefits and risks associated with plan reuse. |
| Runnable processes count | This widget is a graph widget which displays the number of runnable processes of the selected node. Administrators can detect CPU-related bottlenecks early, optimize resource allocation, and ensure that SQL Server continues to meet performance expectations under varying workloads. |
| Runnable tasks count | This widget is a graph widget which displays the number of runnable tasks of the selected node. This metric provides vital insights into CPU utilization and system responsiveness. Administrators can identify bottlenecks early, optimize resource allocation, and maintain a smooth and efficient SQL Server environment. |
| Running processes count | This widget is a graph widget which displays the count of processes running of the selected node. Administrators can gauge the current workload, quickly detect performance bottlenecks, and proactively optimize system performance to maintain a smooth and efficient SQL Server environment. |
| Sleeping processes count | This widget is a graph widget which displays the number of sleeping processes of the selected node. Administrators can effectively manage idle connections, ensure optimal resource allocation, and maintain overall SQL Server health. |
| Suspend processes count | This widget is a graph widget which displays the number of suspended processes of the selected node. Suspended" processes are tasks that are waiting on a resource before they can resume execution. This enables database administrators to proactively address performance bottlenecks, optimize resource allocation, and maintain a well-balanced and responsive MSSQL environment. |
| Transactions | This widget is a graph widget which displays the number of transactions of the selected node. Monitoring transactions involves tracking the start, duration, and commit/rollback of all database transactions and gives insight into the activity level and behavior of database operations. This helps administrators to detect and resolve issues before they impact overall system performance. |
| SQL compilations | This widget is a graph widget which displays the number of SQL compilations of the selected node. This occurs when SQL Server transforms a query into an execution plan.This involves parsing, optimizing, and compiling queries, which may be reused later. It helps ensure that your SQL Server operates efficiently by minimizing overhead and optimizing plan reuse. |
| SQL recompilations | Refers to the process where the database engine re-evaluates and regenerates the execution plan for a SQL statement. It occurs when the SQL Server engine regenerates the execution plan for a query. Database administrators can fine-tune queries and system configurations to maintain a stable and high-performing MSSQL environment. |
| System wait time | Refers to the amount of time that a process or transaction spends waiting for resources or events to proceed with its execution. It helps diagnose performance issues, ensures efficient resource use, and maintains an optimal SQL Server environment. Database administrators can troubleshoot delays, tune performance, and plan capacity improvements effectively. |
| Average page splits | Refers to the average number of times a data page is split during insert, update, or delete operations. Database administrators gain critical insights into index fragmentation, resource usage, and the efficiency of data storage. |
Query performance
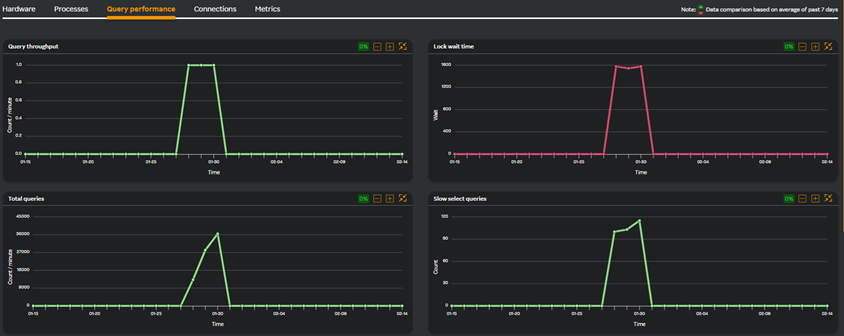
A screen similar to the following appears when you select the Query performance tab.
| Metric Name | Description |
|---|---|
| Query throughput | Refers to the rate at which queries are processed over a certain period. It is essential for understanding the overall performance of your SQL Server instance, detecting issues promptly, planning for future growth, and ensuring that queries execute efficiently. |
| Lock wait time | Refers to the duration a transaction or query must wait for a lock to be released by another transaction. Administrators can gain critical visibility into the concurrency behavior of SQL Server. This helps in identifying blocking issues, optimizing queries for better performance, and ensuring that resources are allocated efficiently. |
| Total queries | Refers to the cumulative number of SQL statements (queries) executed against the database since it started. This helps gain valuable insights into database workload, aids in capacity planning, and provides early detection of performance issues |
| Slow select queries | Refer to SQL SELECT statements that take an unusually long time to execute, often resulting in poor performance. It helps identify performance issues, optimize resource use, and ensure a smooth user experience. |
| Query threshold | Refers to a predefined limit set to identify and flag queries that exceed a certain execution time or resource usage. It helps ensure your database performs optimally, alerts you to potential issues, and provides a better user experience. |
Connections
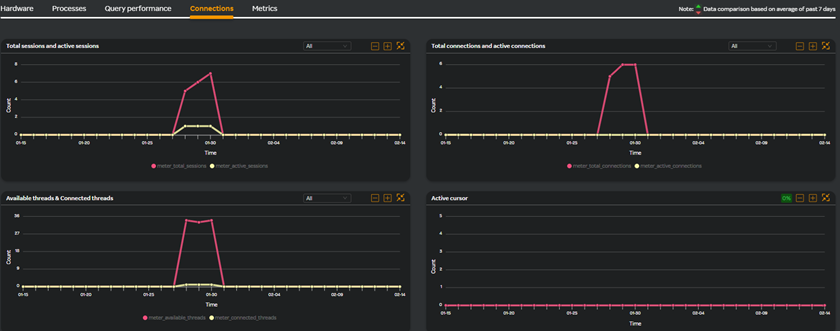
A screen similar to the following appears when you select the Connections tab.
| Metric Name | Description |
|---|---|
| Total sessions and active sessions | Provides insights into how many users or processes are currently connected to the database and actively interacting with it. This is essential for understanding the overall workload, ensuring optimal resource utilization, detecting abnormal patterns early, and maintaining both performance and security in your SQL Server environment. |
| Total connections and active connections | Helps in understanding the current load on the database and managing resources efficiently, particularly in high-concurrency environments This helps administrators gain crucial insights into system workload, potential connection issues, and resource consumption. |
| Available threads & Connected threads | Helps track database capacity for handling concurrent connections, impacting performance, scalability, and resource management. This ensures that the system has adequate capacity to handle workloads, to identify potential performance bottlenecks early, and to optimize resource allocation. |
| Active cursor | Refers to a cursor currently in use, actively fetching or manipulating data within an open transaction or query. It helps detect inefficient processing patterns, prevents resource leaks, and enables proactive optimization of query execution. |
| Cached cursor count | Refers to the number of cursors that are kept in memory (cached) to be reused for subsequent operations within the same session. Administrators can ensure that cursor caching is functioning effectively to optimize performance and manage memory usage. |
| Cursor requests | The number of requests made to create or use a cursor within the database. It allows you to detect inefficient, resource-intensive processing early on so that you can maintain a high-performing, responsive SQL Server environment. |
| Session details | Provides information on the number of active database sessions or connections at any given time. This helps maintain an efficient, secure, and high-performing SQL Server environment. |
Metrics
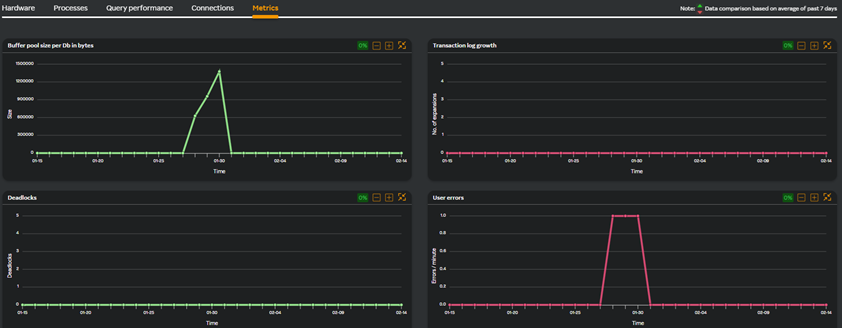
A screen similar to the following appears when you select the Metrics tab.
| Metric Name | Description |
|---|---|
| Buffer pool size per Db in bytes | This widget is a graph widget which displays the buffer pool size per database in bytes of the selected database. Database administrators can ensure efficient memory utilization, maintain high performance through effective caching, diagnose potential memory pressure issues early, and plan for future resource need. |
| Transaction log growth | This widget is a graph widget which displays the number of expansions of the selected database. Administrators can prevent disk space exhaustion, maintain optimal performance, ensure data recoverability, and proactively identify issues. |
| Deadlocks | Represents the number of deadlock incidents detected in the database. They occur when two or more transactions block each other by holding locks on resources the others need. This not only helps in maintaining system stability and performance but also helps pinpoint and eliminate inefficient transaction designs. |
| User errors | This widget is a graph widget which displays the number of user errors of the selected node. This indicates issues in application logic or how queries are being issued. User errors in MSSQL helps ensure that application-related issues are identified and addressed quickly. |
| Buffer pool size in bytes | This widget is a graph widget which displays the number of bufferpool size (in bytes) of the selected node. As an administrator, you can gain critical insights into how efficiently SQL Server is using memory for data caching, which directly influences query response times and overall system performance. |
| System buffer pool hit percentage | This widget is a graph widget which displays the number of system bufferpool hit percent of the selected node. The buffer pool hit percentage shows the percentage of page requests that are satisfied from memory versus those that require disk access. It directly reflects SQL Server’s ability to serve data from fast memory rather than slower disk storage. Maintaining a consistently high hit ratio leads to lower latency, improved query performance, and overall system efficiency. |
| Total open files | The number of file descriptors currently in use by the database. Administrators can better assess disk I/O performance, identify potential bottlenecks, and allocate resources efficiently. |
Multi-column Filter
Query performance
- Multi-column filter can be applied on numeric columns within the Query performance Table to refine the displayed data based on specific conditions.
- When the user clicks on the “Filter by” option, user can apply filter below numeric columns
| Column Name | Description |
|---|---|
| Total execution | Total number of query executions recorded. |
| Maximum execution time (s) | The longest query execution time recorded in seconds. |
| Maximum execution timestamp | Date and time when the longest-running query was recorded. |
- Each filter condition is applied using the below operators and value ( user input based on the unit)
| Operator |
|---|
| Greater than |
| Less than |
| Equals |
| Greater than or equals |
| Less than or equals |
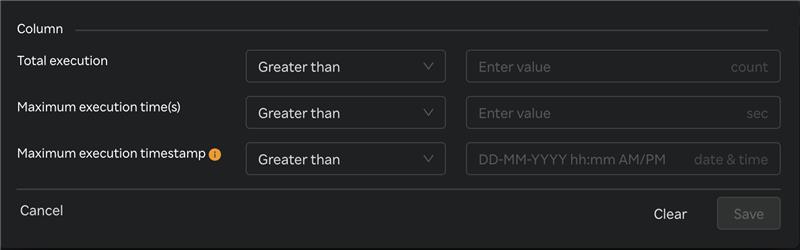
- Once filters & conditions are applied save button is enabled & click "Save" to apply the filter.
- Once filters & conditions are applied it displays no. of filters are applied.

note
- Filters are applied using AND logic — all specified conditions must be met for a record to be displayed.
- Only numeric columns support filtering; non-numeric fields (e.g., text or categorical values) are excluded from the filter options.
- When the Maximum Execution Timestamp (s) filter is applied, the system reviews each query in the table. If a query was executed within the time frame selected in the top-right corner, it displays that query’s maximum execution timestamp and maximum execution time.
- If no records match the selected filters, the table will display a message such as “No data".
- The multi-column filter state persists until the user clears filters by clicking on "Clear" button when Filter by button is clicked.
- A "Reset" button is available to clear all applied filters and restore the table to its original, unfiltered state. This button is enabled only when one or more filters are currently applied.

Connections --> Session details
- Multi-column filter can be applied on numeric columns within the Connections --> Session details Table to refine the displayed data based on specific conditions.
- When the user clicks on the “Filter by” option, user can apply filter below numeric columns
| Column Name | Description |
|---|---|
| Queries executed | Total number of queries executed during the session. |
| Timestamp | Date and time when the session activity was recorded. |
- Each filter condition is applied using the below operators and value ( user input based on the unit)
| Operator |
|---|
| Greater than |
| Less than |
| Equals |
| Greater than or equals |
| Less than or equals |
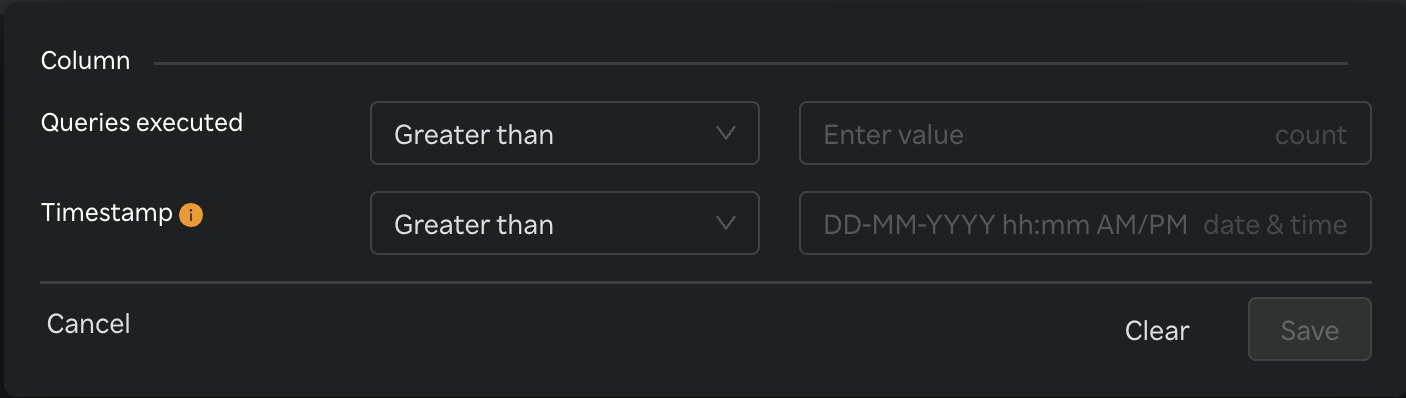
- Once filters & conditions are applied save button is enabled & click "Save" to apply the filter.
- Once filters & conditions are applied it displays no. of filters are applied.
note
- Filters are applied using AND logic — all specified conditions must be met for a record to be displayed.
- Only numeric columns support filtering; non-numeric fields (e.g., text or categorical values) are excluded from the filter options.
- If no records match the selected filters, the table will display a message such as “No data".
- The multi-column filter state persists until the user clears filters by clicking on "Clear" button when Filter by button is clicked.
- A "Reset" button is available to clear all applied filters and restore the table to its original, unfiltered state. This button is enabled only when one or more filters are currently applied.