APM Topology
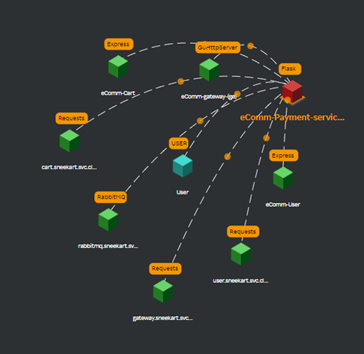
Topology provides a complete visual representation of a network of applications and endpoints. View the connections, flow of interactions, and color-coded health status of every entity in detail to understand the cause of any problem that impacts the real user.
Adding a group
- Click the Add group tab.
- Enter the name of the group you want to create in the Add group window.
- Choose applications from the Choose applications drop-down list. The applications you have selected are listed below.
note
Click the remove ![]() icon against the application if you do not want to add it to the group.
icon against the application if you do not want to add it to the group.
- Click Add.
Choosing a Group
- Select the group you want to view from the Choose group drop-down list. The topology for the selected group is displayed.
note
Click the edit ![]() icon or the delete
icon or the delete ![]() icon to edit or delete the group.
icon to edit or delete the group.
Topology with Infra Correlation
If an application is associated with a VM, you will see the INFRA block as in the following screen.
note
The Map view tab is selected by default.
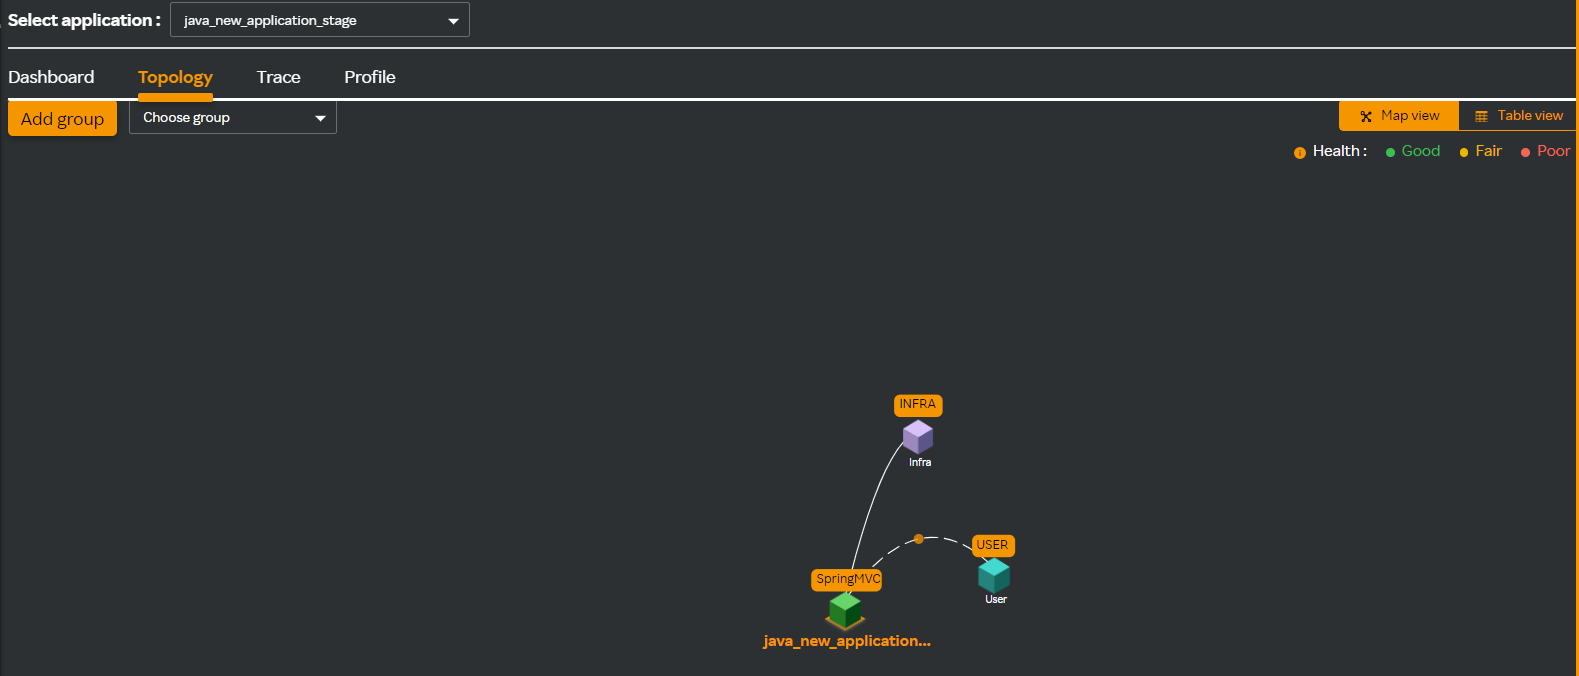
Clicking the INFRA block takes you the Infrastructure overview screen where you can see the details of the VM that is associated with the application. You can view the number of VMs associated along with the application name.
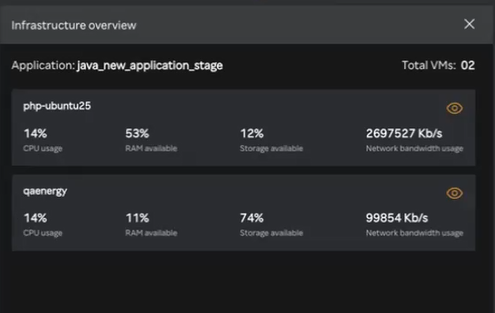
Click the eye icon against the VM to take you to the APM > Dashboard > Infrastructure page where you can see the details of the VM that is associated with the application.
To view the VM details from the Table view perform the following procedure.
- Click the Table view tab where you can see the user associated to an application. The application is connected to a VM as in the following screen.
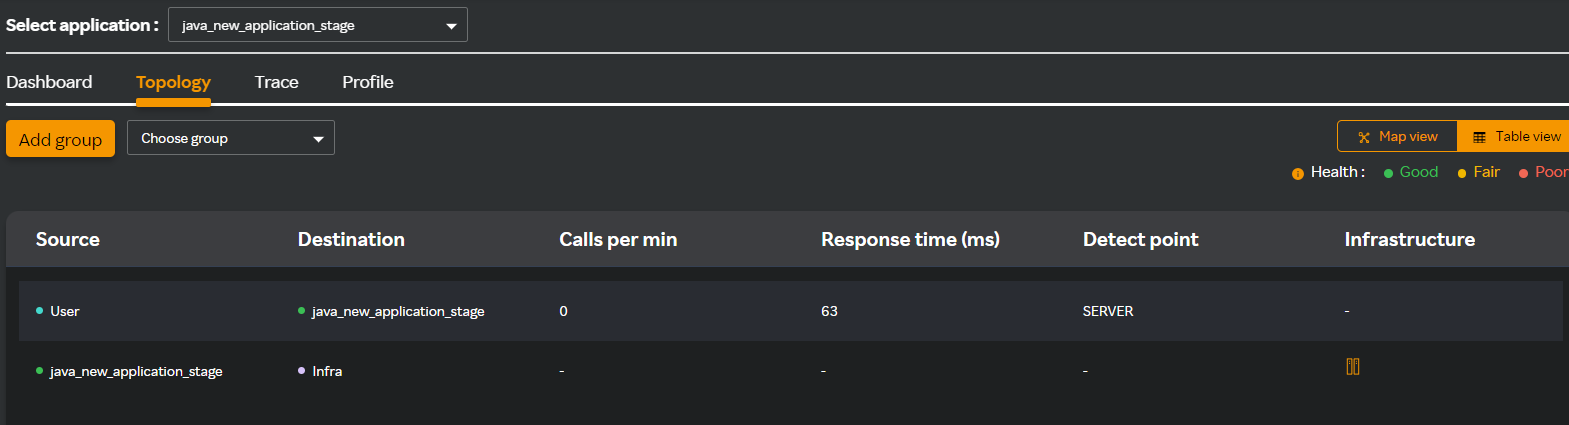
- Click the
 icon which will take you to the Infrastructure overview screen where you can see the details of the VM that is associated with the application.
 - Click the
 icon against the VM to take you to the APM > Dashboard > Infrastructure page where you can see the selected VM details.
note
APM Infra correlation support is present for Java, PHP, Node JS and Golang agents.
To view the VM details from the Table view perform the following procedure.
- Click the Table view tab where you can see the user associated to an application. The application is connected to a VM as in the following screen.
- Click the icon which will take you to the Infrastructure overview screen where you can see the details of the VM that is associated with the application.
- Click the icon against the VM to take you to the APM > Dashboard > Infrastructure page where you can see the selected VM details.
note
APM Infra correlation support is present for Java, PHP, Node JS and Golang agents.
Topology node coloring
Conjectural nodes: Red color (For example, Database / MQ nodes / SpringRestTemplate/ OkHttp) USER node: Blue color
Nodes with agent installed or directly detected service - coloring is according to health based on the following apdex calculation:
- Green - good (Apdex 0.84 to 1)
- Yellow - fair (Apdex 0.69 to 0.83)
- Red - poor (Apdex 0 to 0.68)