Cassandra
Use the following procedure for monitoring the Cassandra database.
- Navigate to Database monitoring on the left pane.
- Select Cassandra from the Select database drop-down list.
- Select a service from the Select service drop-down list.
- Select a database from the Select database drop-down list.
The following screen appears along with the various available tabs.
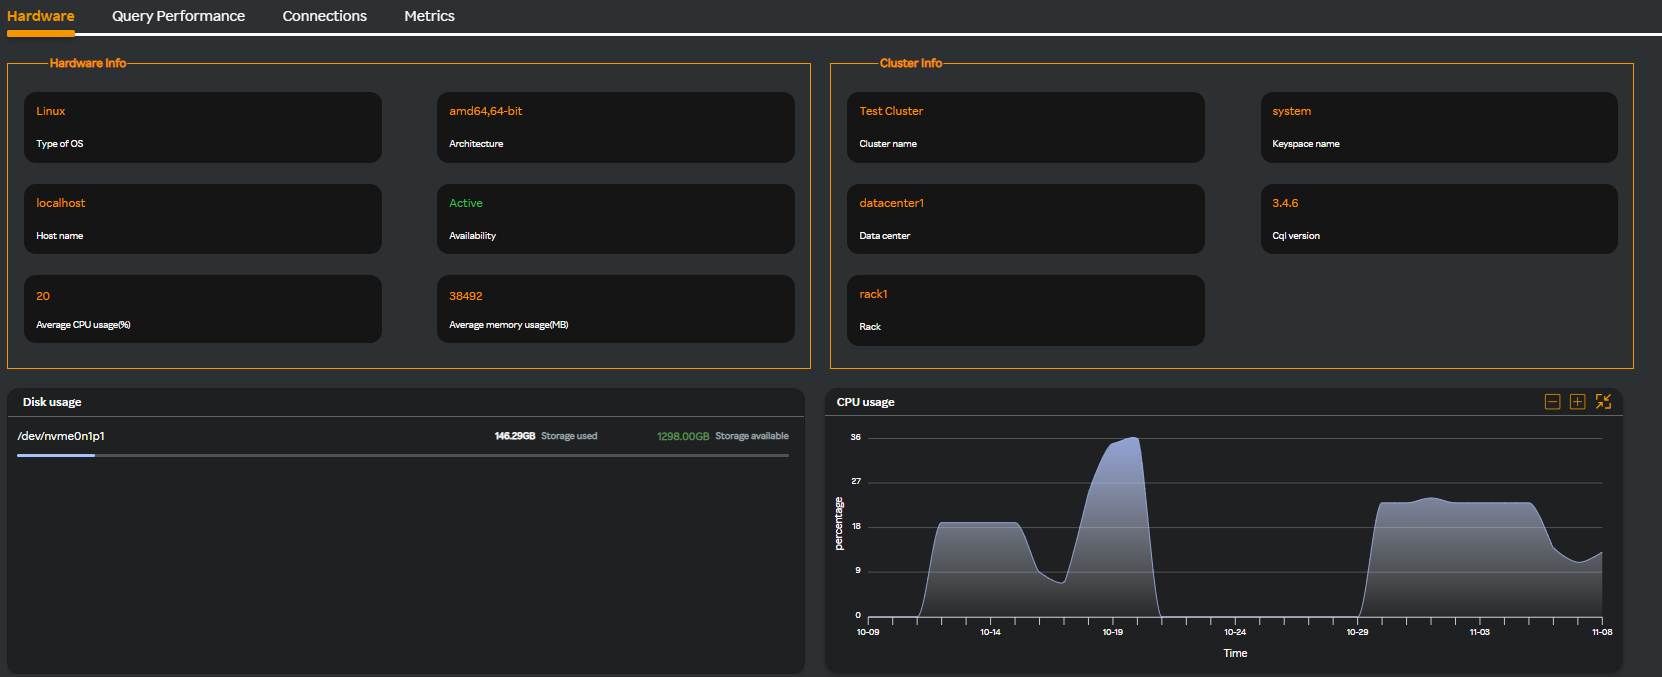
Hardware
The Hardware tab is selected by default. The following widgets are displayed.
| Widget Name | Description |
|---|---|
| Disk usage | Disk usage |
| CPU usage | CPU utilization of host |
| Memory usage | Memory utilization of host |
| Network I/O | Network input/output data in MB |
| Event details | Database Background Events List |
Query Performance
Clicking the Query Performance tab and selecting the threshold from the Query threshold drop-down list displays the following screen.
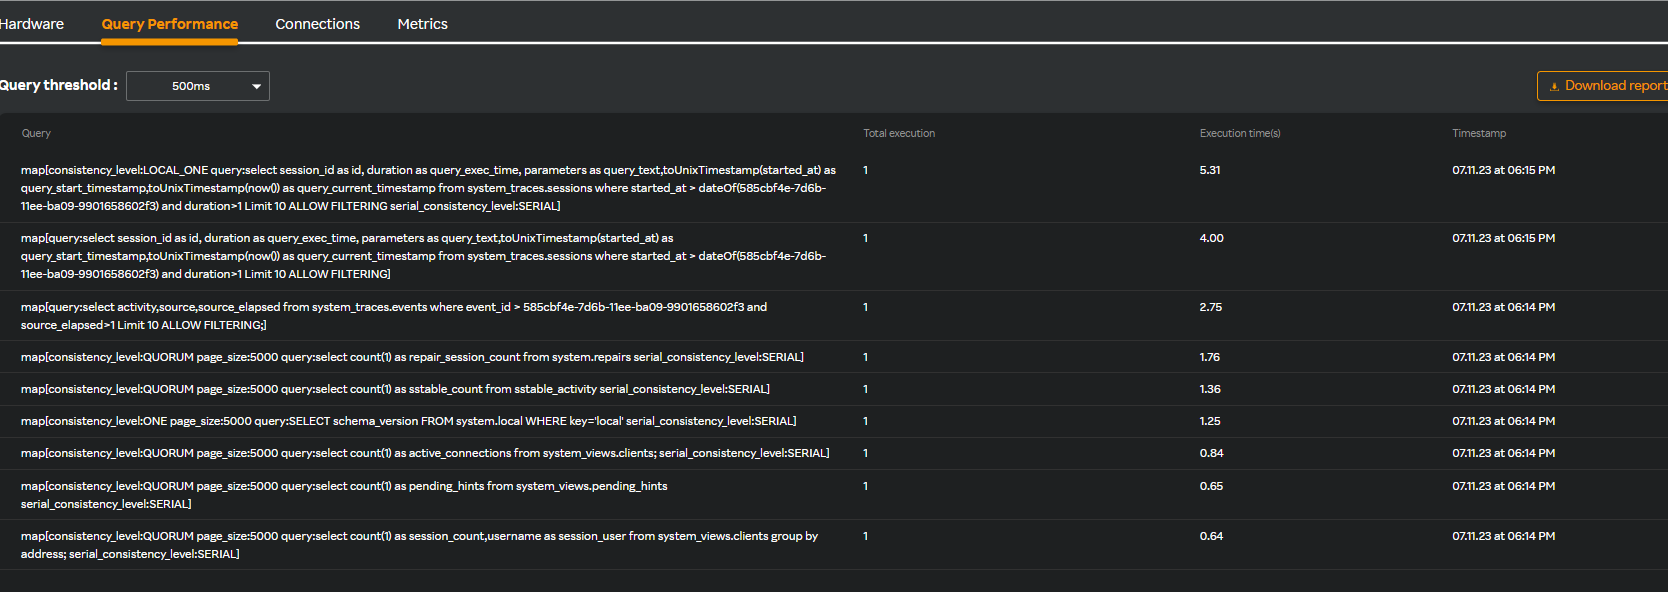
note
You can download the Query Performance table in PDF format by clicking the  icon. Only the top 100 entries are downloaded if there are more than 100 entries for downloading.
Connections
Clicking the Connections tab displays the following widgets as in the following screen.
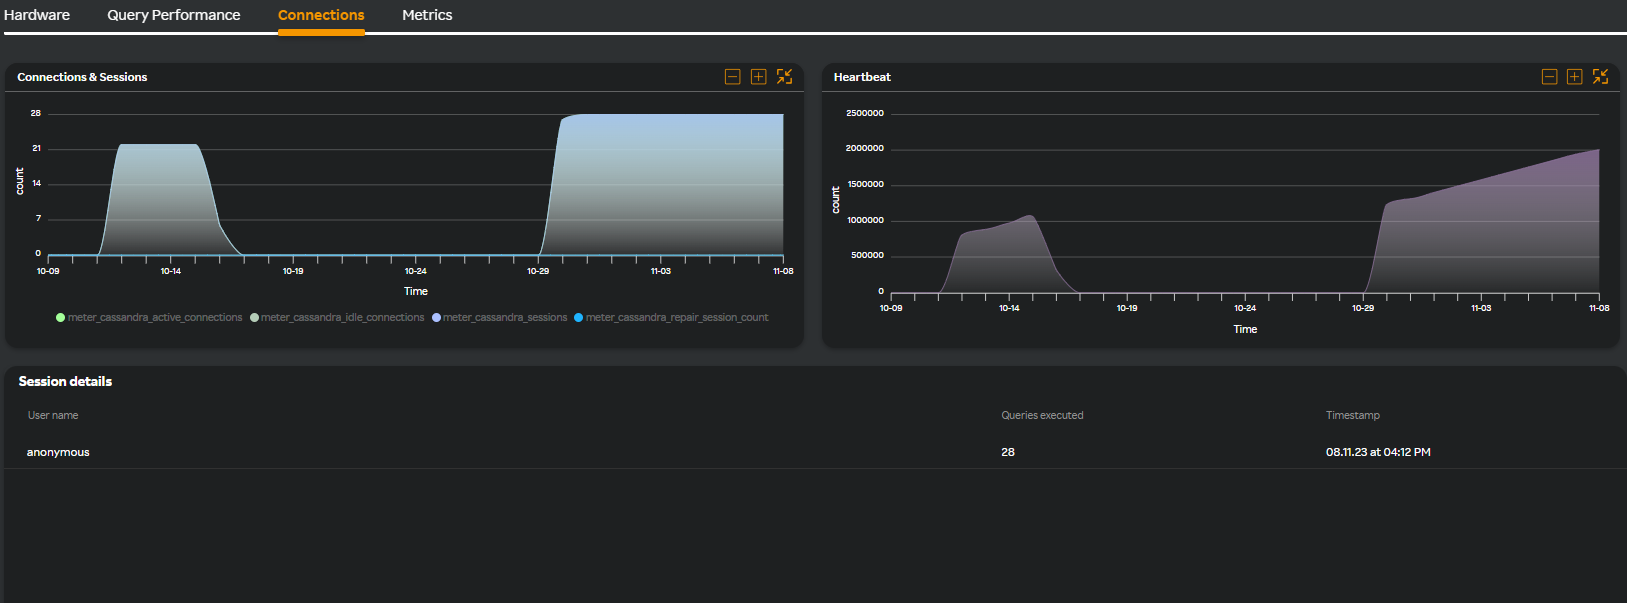
| Widget Name | Description |
|---|---|
| Connections & Sessions | Database number of connections & sessions count |
| Heartbeat | Count to check database is alive and responding |
| Session details | Session details having users and queries count with time |
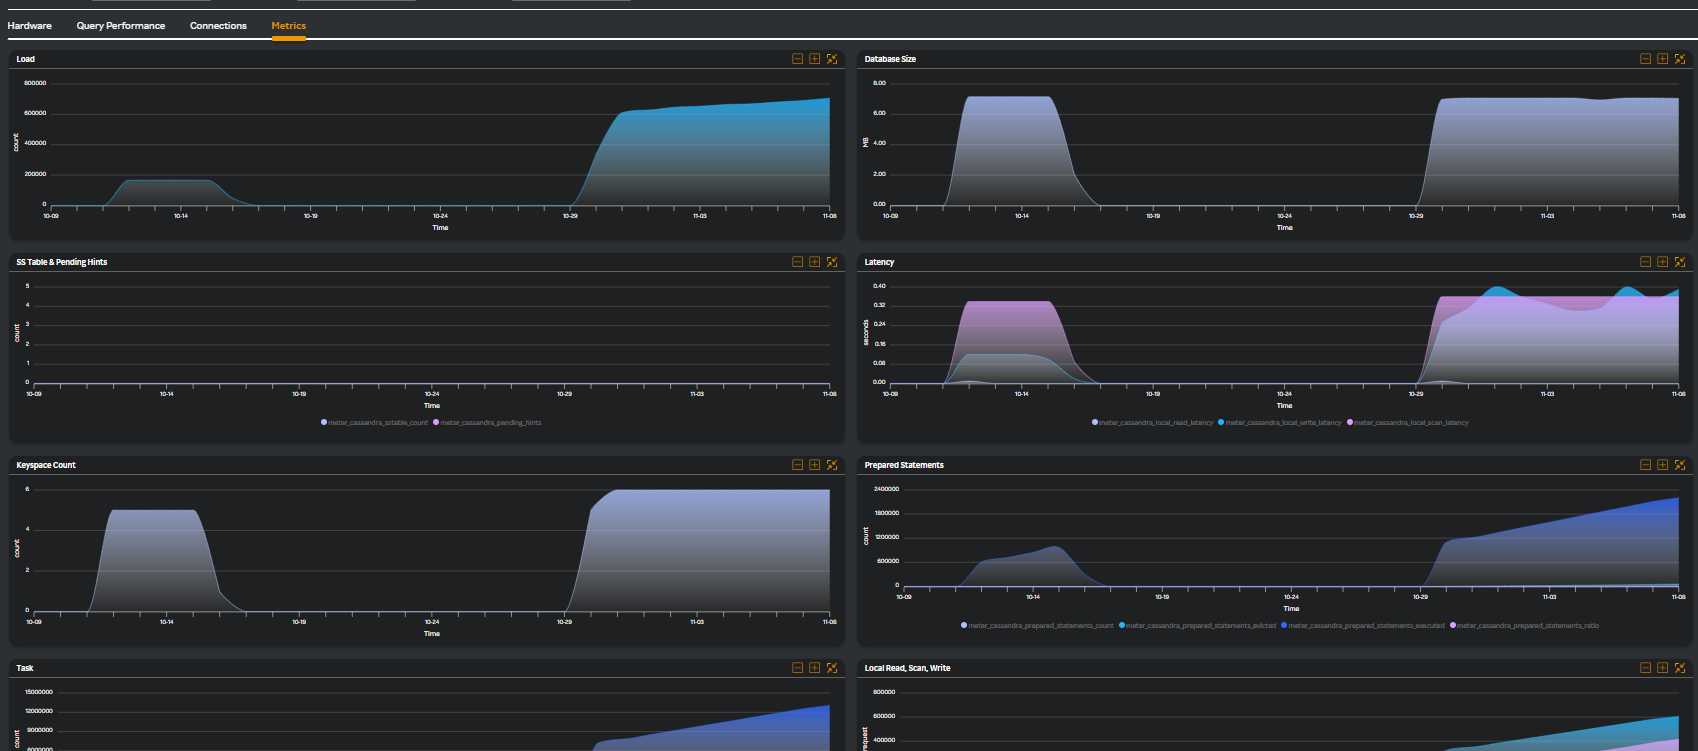
Metrics
Clicking the Metrics tab displays the following widgets.
| Widget Name | Description |
|---|---|
| Load | Number of requests |
| Database Size | Database size |
| SS Table & Pending Hints | Building blocks of the total data stored in the database and request pending hints count |
| Latency | Read, write and scan latency of request |
| Keyspace Count | Number of keyspace count |
| Prepared Statements | Number of prepared statements |
| Task | Number of tasks |
| Local Read,Scan,Write | latency of requests in milliseconds |
| Cache | Counters and keys cache hit rate |
| Compaction | Compaction size in and out in MB |
Multi-column Filter
Query performance
- Multi-column filter can be applied on numeric columns within the Query performance Table to refine the displayed data based on specific conditions.
- When the user clicks on the “Filter by” option, user can apply filter below numeric columns
| Column Name | Description |
|---|---|
| Total execution | Total number of query executions recorded. |
| Maximum execution time (s) | The longest query execution time recorded in seconds. |
| Maximum execution timestamp | Date and time when the longest-running query was recorded. |
- Each filter condition is applied using the below operators and value ( user input based on the unit)
| Operator |
|---|
| Greater than |
| Less than |
| Equals |
| Greater than or equals |
| Less than or equals |
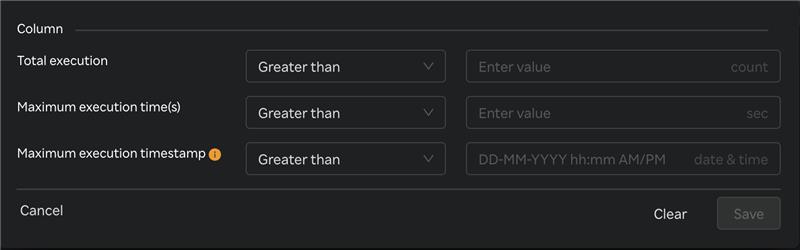
- Once filters & conditions are applied save button is enabled & click "Save" to apply the filter.
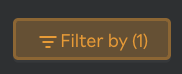
- Once filters & conditions are applied it displays no. of filters are applied.
note
- Filters are applied using AND logic — all specified conditions must be met for a record to be displayed.
- Only numeric columns support filtering; non-numeric fields (e.g., text or categorical values) are excluded from the filter options.
- When the Maximum Execution Timestamp (s) filter is applied, the system reviews each query in the table. If a query was executed within the time frame selected in the top-right corner, it displays that query’s maximum execution timestamp and maximum execution time.
- If no records match the selected filters, the table will display a message such as “No data".
- The multi-column filter state persists until the user clears filters by clicking on "Clear" button when Filter by button is clicked.
- A "Reset" button is available to clear all applied filters and restore the table to its original, unfiltered state. This button is enabled only when one or more filters are currently applied.

Connections --> Session details
- Multi-column filter can be applied on numeric columns within the Connections --> Session details Table to refine the displayed data based on specific conditions.
- When the user clicks on the “Filter by” option, user can apply filter below numeric columns
| Column Name | Description |
|---|---|
| Queries executed | Total number of queries executed during the session. |
| Timestamp | Date and time when the session activity was recorded. |
- Each filter condition is applied using the below operators and value ( user input based on the unit)
| Operator |
|---|
| Greater than |
| Less than |
| Equals |
| Greater than or equals |
| Less than or equals |
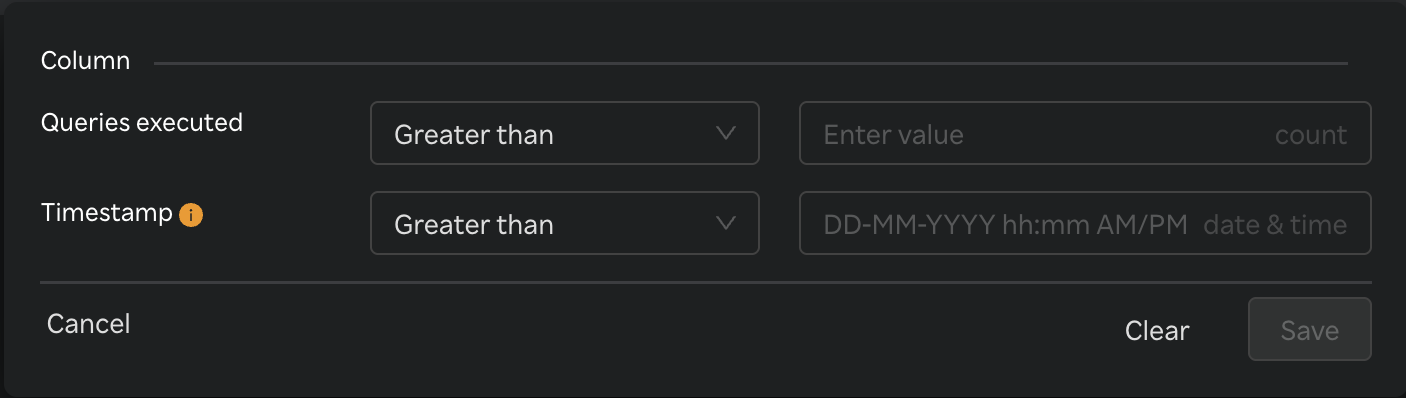
- Once filters & conditions are applied save button is enabled & click "Save" to apply the filter.
- Once filters & conditions are applied it displays no. of filters are applied.
note
- Filters are applied using AND logic — all specified conditions must be met for a record to be displayed.
- Only numeric columns support filtering; non-numeric fields (e.g., text or categorical values) are excluded from the filter options.
- If no records match the selected filters, the table will display a message such as “No data".
- The multi-column filter state persists until the user clears filters by clicking on "Clear" button when Filter by button is clicked.
- A "Reset" button is available to clear all applied filters and restore the table to its original, unfiltered state. This button is enabled only when one or more filters are currently applied.