Oracle
Use the following procedure for monitoring the Oracle database.
- Navigate to Database monitoring on the left pane.
- Select Oracle from the Select database drop-down list.
- Select a service from the Select service drop-down list.
- Select a database from the Select database drop-down list.
The following screen appears along with the various available tabs.
- [Hardware](#hardware
- Query Performance
- Connections
- Metrics
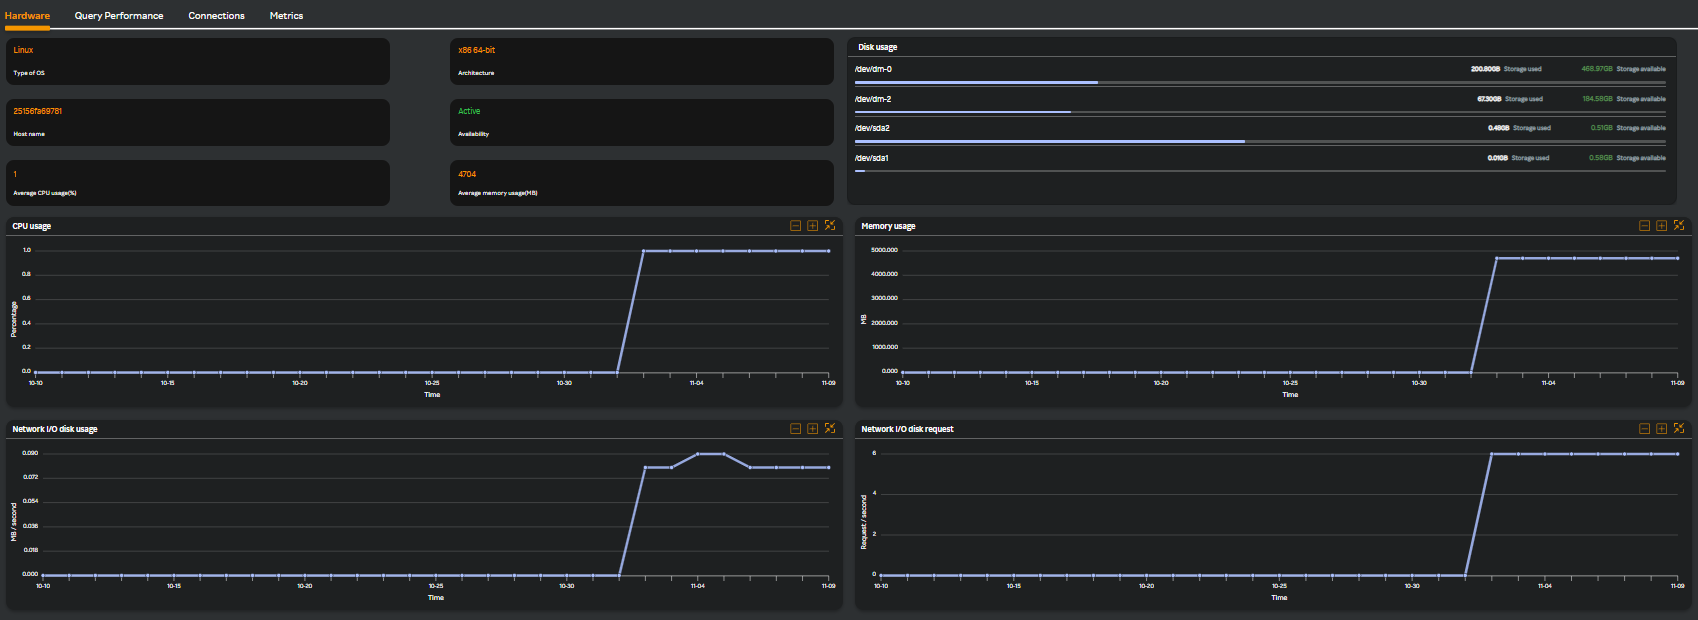
Hardware
The Hardware tab is selected by default. The following widgets are displayed.
| Widget Name | Description |
|---|---|
| Disk usage | Disk usage of the database server |
| CPU usage | CPU usage of the database processes |
| Memory usage | Memory usage of the database server |
| Network I/O disk usage | Network disk usage of the database server |
| Network I/O disk request | Network disk requested from the database server |
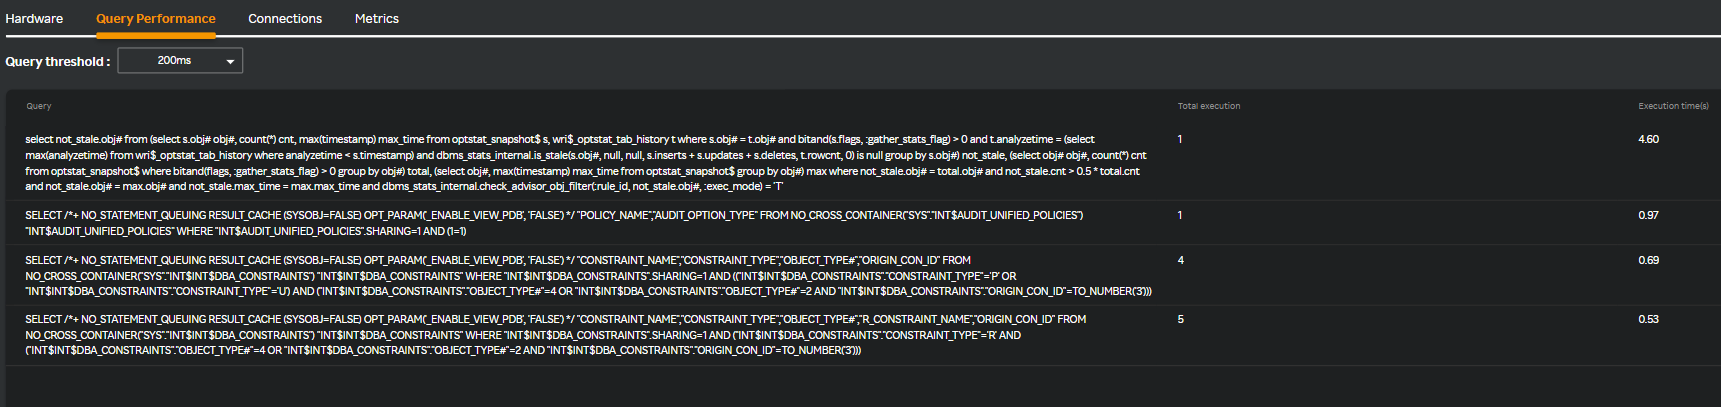
Query Performance
Clicking the Query Performance tab and selecting the threshold from the Query threshold drop-down list displays the following screen.
note
You can download the Query Performance table in PDF format by clicking the  icon. Only the top 100 entries are downloaded if there are more than 100 entries for downloading.
Connections
Clicking the Connections tab displays the following widgets as in the following screen.
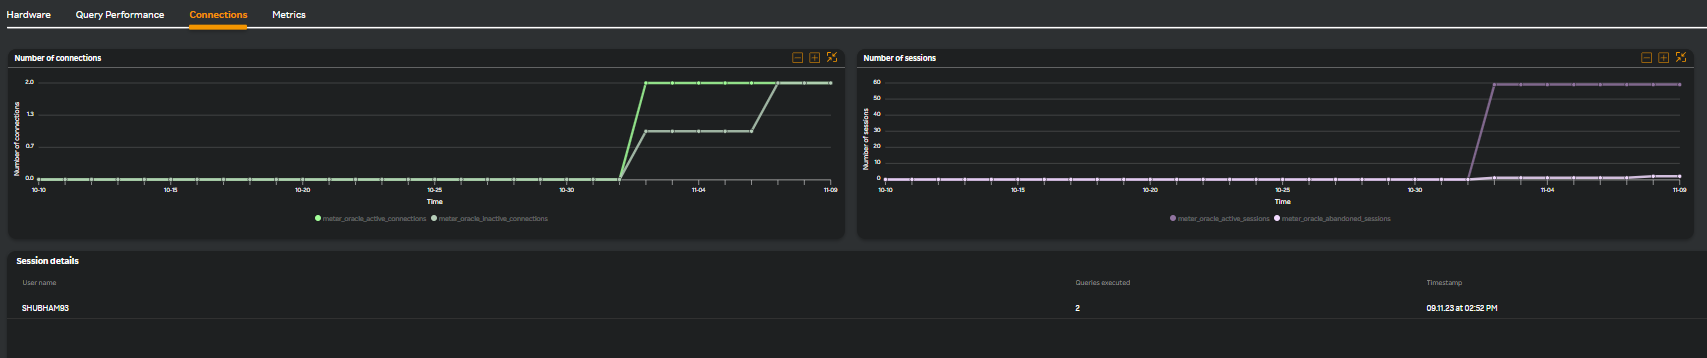
| Widget Name | Description |
|---|---|
| Number of connections | Represents the total connections to the DB server (Count) |
| Number of sessions | Represents the total sessions in the DB server |
| Session details | Details of all unique users, number of queries the user is currently running, and last active time of the user |
Metrics
Clicking the Metrics tab displays the following widgets.
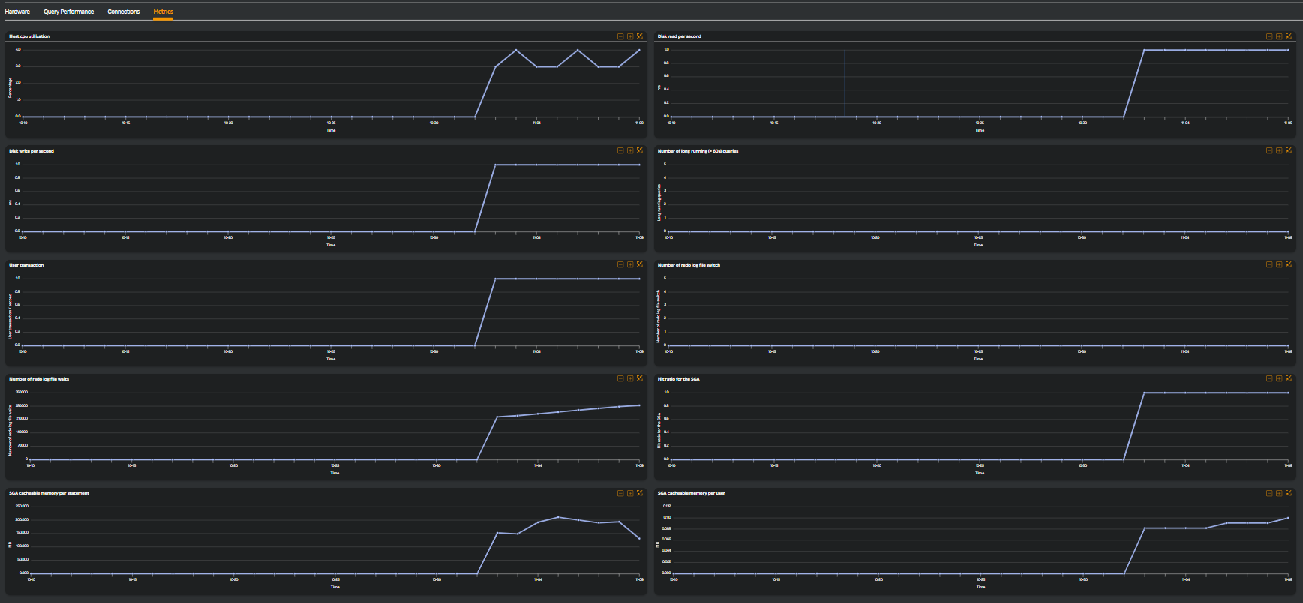
| Widget Name | Description |
|---|---|
| Host cpu utilization | This metric represents the CPU used across hosts. |
| Disk read per second | Number of times per second the DB server reads from the files (count value) |
| Disk write per second | Number of times per second the DB server writes from the files (count value) |
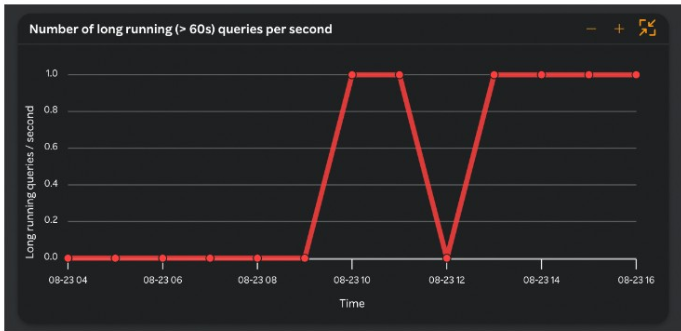
| Number of long running (>60s) queries | Queries with status as 'active' and type not equal to 'Background' time greater than 60 seconds. |
| User transaction | Total number of transactions per second (commits and rollback). |
| Number of redo log file switch | Count of 'log file switch completion' event from V$SYSTEM_EVENT. |
| Number of redo log file waits | Count of 'log file parallel write' event from V$SYSTEM_EVENT. |
| Hit ratio for the SGA | Measure of the effectiveness of the Oracle database buffer. The higher the buffer hit ratio, the more frequently Oracle found a data block in memory and avoid a disk I/O. Calculated using (physical reads - physical reads direct (lob) - physical reads direct)/ session logical reads. |
| SGA cacheable memory per statement | Shared pool cache in SGA per statement. |
| SGA cacheable memory per user | Shared pool cache in SGA per user. |
Number of long running (> 60s) queries per second
Multi-column Filter
Query performance
- Multi-column filter can be applied on numeric columns within the Query performance Table to refine the displayed data based on specific conditions.
- When the user clicks on the “Filter by” option, user can apply filter below numeric columns
| Column Name | Description |
|---|---|
| Total execution | Total number of query executions recorded. |
| Maximum execution time (s) | The longest query execution time recorded in seconds. |
| Maximum execution timestamp | Date and time when the longest-running query was recorded. |
- Each filter condition is applied using the below operators and value ( user input based on the unit)
| Operator |
|---|
| Greater than |
| Less than |
| Equals |
| Greater than or equals |
| Less than or equals |
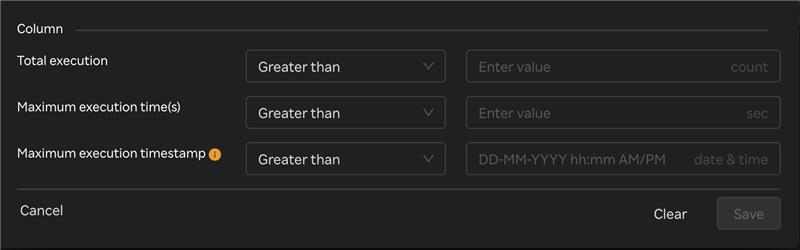
- Once filters & conditions are applied save button is enabled & click "Save" to apply the filter.
- Once filters & conditions are applied it displays no. of filters are applied.

note
- Filters are applied using AND logic — all specified conditions must be met for a record to be displayed.
- Only numeric columns support filtering; non-numeric fields (e.g., text or categorical values) are excluded from the filter options.
- When the Maximum Execution Timestamp (s) filter is applied, the system reviews each query in the table. If a query was executed within the time frame selected in the top-right corner, it displays that query’s maximum execution timestamp and maximum execution time.
- If no records match the selected filters, the table will display a message such as “No data".
- The multi-column filter state persists until the user clears filters by clicking on "Clear" button when Filter by button is clicked.
- A "Reset" button is available to clear all applied filters and restore the table to its original, unfiltered state. This button is enabled only when one or more filters are currently applied.

Connections --> Session details
- Multi-column filter can be applied on numeric columns within the Connections --> Session details Table to refine the displayed data based on specific conditions.
- When the user clicks on the “Filter by” option, user can apply filter below numeric columns
| Column Name | Description |
|---|---|
| Queries executed | Total number of queries executed during the database session. |
| Timestamp | Date and time when the session data was recorded. |
- Each filter condition is applied using the below operators and value ( user input based on the unit)
| Operator |
|---|
| Greater than |
| Less than |
| Equals |
| Greater than or equals |
| Less than or equals |
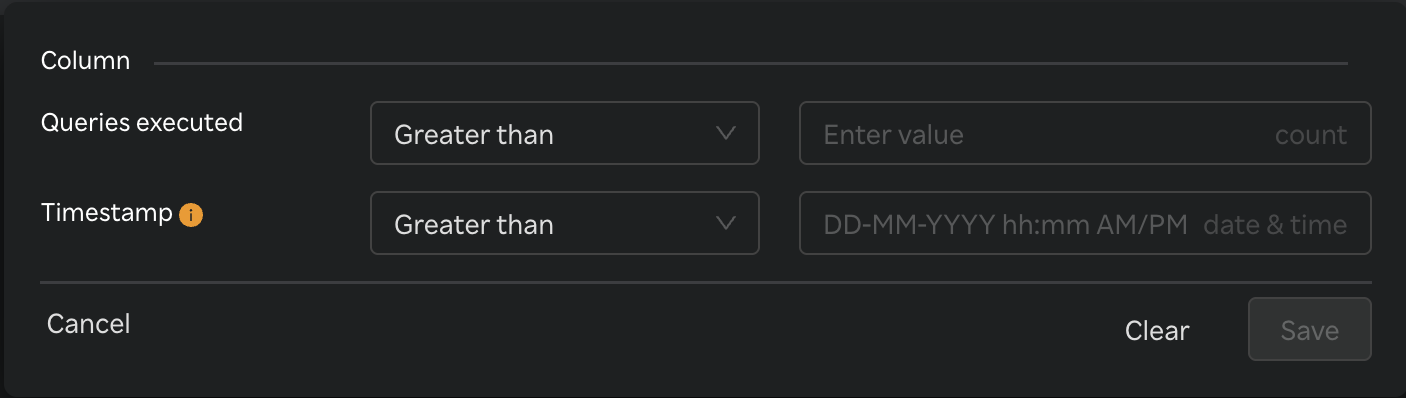
- Once filters & conditions are applied save button is enabled & click "Save" to apply the filter.
- Once filters & conditions are applied it displays no. of filters are applied.
note
- Filters are applied using AND logic — all specified conditions must be met for a record to be displayed.
- Only numeric columns support filtering; non-numeric fields (e.g., text or categorical values) are excluded from the filter options.
- If no records match the selected filters, the table will display a message such as “No data".
- The multi-column filter state persists until the user clears filters by clicking on "Clear" button when Filter by button is clicked.
- A "Reset" button is available to clear all applied filters and restore the table to its original, unfiltered state. This button is enabled only when one or more filters are currently applied.