Synthetic Endpoint Monitoring alerts
Role: Site Reliability Engineers (SREs)
You can configure Synthetic Endpoint Monitoring alerts so that you are notified of issues based on the metrics and threshold values you set.
The following procedure allows you to set alerts for Synthetic Endpoint Monitoring. You can add alerts for a group or endpoints within the group. Metrics for the group and endpoints vary.
Group alerts:
At the group level, you can set up alerts for the group's response time and availability. For example, you can raise an alert for a group if the response time is greater than 0 ms (Threshold value) in the window of 1 minute (Time period) and close the alert if there is no breach for a period of 1 minute (Recovery period). If you have set the Silence period to 5 minutes, alerts are not triggered during this time period.
Endpoint alerts:
At the endpoint level, you can set up alerts for the endpoint's response time and availability. You can select a single endpoint or multiple endpoints within a group and alerts will be triggered for each endpoint based on the values you select. For example, you can raise an alert for endpoints if the endpoint response time is greater than 1 ms (Threshold value) in the window of 2 minutes(Time period) and close the alert if there is no breach for a period of 2 minutes (Recovery period). If you have set the Silence period to 6 minutes, alerts are not triggered during this time period.
Login to the SixthSense Observability portal.
Click the Alerts
 icon on the left pane.
Select Synthetic monitoring from the Search capability drop-down list.
Select an existing service or search for a service from the Search service drop-down list.
Click Add alert to add a new alert.
The following Add alert window appears.
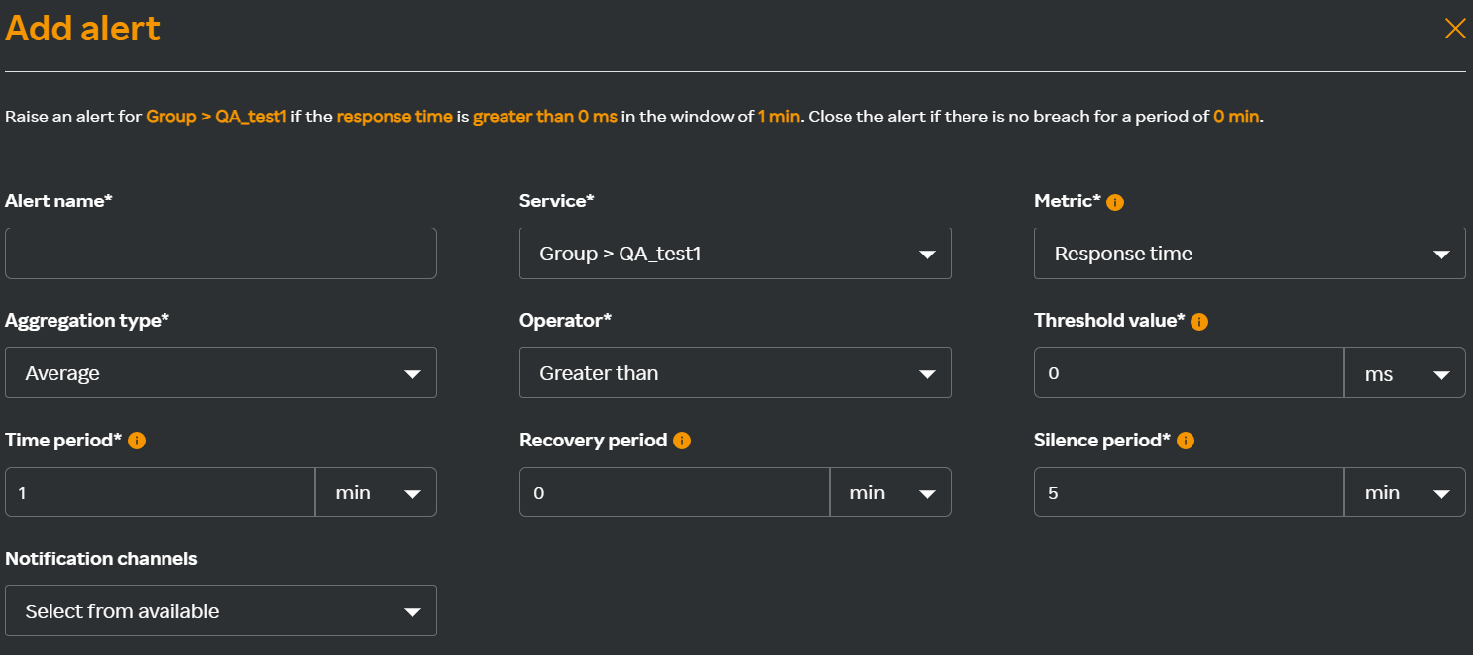
In the Add alert window fill in the following details:
| Field | Description |
|---|---|
| Alert name | Name of the alert. Note that only alphanumeric and a single space between words are allowed. |
| Service | List of available services. |
| Metric | The metric for which you want to trigger an alert. The threshold is matched with the metric's real-time value. If you select Endpoint response time or Endpoint availability, Endpoint field is displayed for you to select from the available endpoints. For more information about the supported metrics for each capability, see Supported metrics for alerts. |
| Endpoint | Select an endpoint or multiple endpoints from the available endpoints in the drop-down list. |
| Aggregation type | The options available for this drop-down are based on the metric you select in the Metric drop-down list. For the available options, see Aggregation type options. |
| Operator | Select greater or lesser than, equal to, greater than or equal to, or lesser than or equal to. |
| Threshold value | Select a threshold value. Alerts are triggered if the value over the given period is greater than or equal to the threshold you select. |
| Time period | The length of time for which the alert is evaluated. |
| Recovery period | An open alert is marked as closed if there are no new breaches after it reaches the specified period |
| Silence period | The time during which alerts are not triggered. |
| Notification channels | The list of configured notification channels. You can select multiple notification channels that are available. If you haven't added a notification channel yet, click Create new channel. For more informaiton about adding notification channels, see step 4 for adding an email notification channel, or see step 4 for adding a slack channel, or see step 4 for adding a webhook notification channel. |
| Alert tags | Enter a key and value for an alert tag. The best practice for naming a key would be the capability name followed by the application name at the backend. For example, SM-Oauth where SM is the capability name and oAuth is the service name. The value would be the name of the metrics followed by the capability. For example Response-time-SM where Response time is the metrics and SM is the capability name. |
- Click Add. The alert is added successfully.