Nodes
The Nodes card displays the node details such as the node name, IP address, CPU usage, Memory usage, storage, and status in the cluster as in the following screen.
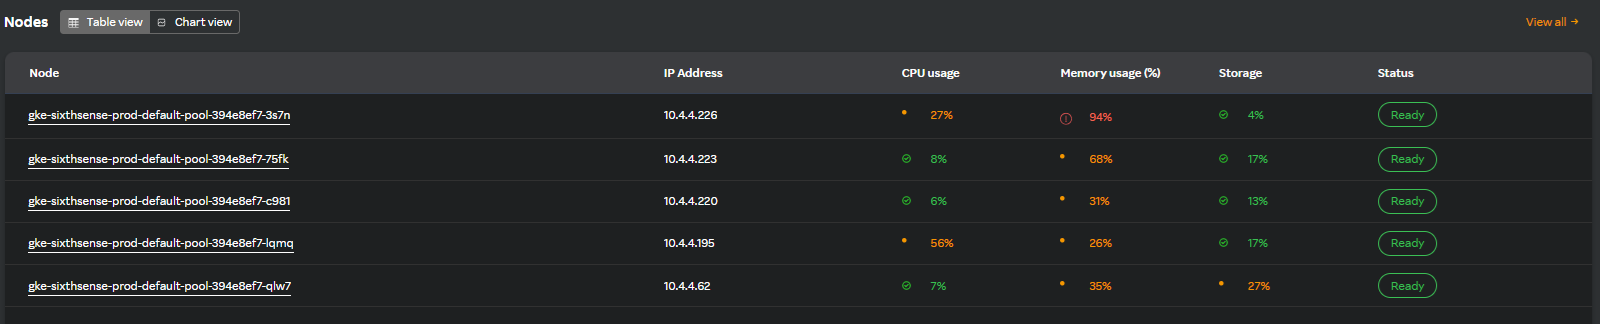
Click View all in the Nodes widget header to view all the available nodes.
note
By default the Table view is selected and only 5 nodes are displayed in the card.
Viewing nodes in a chart view
You can view the nodes' metrics in a chart view which displays each metric in a graph format.
Click the Chart view tab. A screen similar to the following appears.
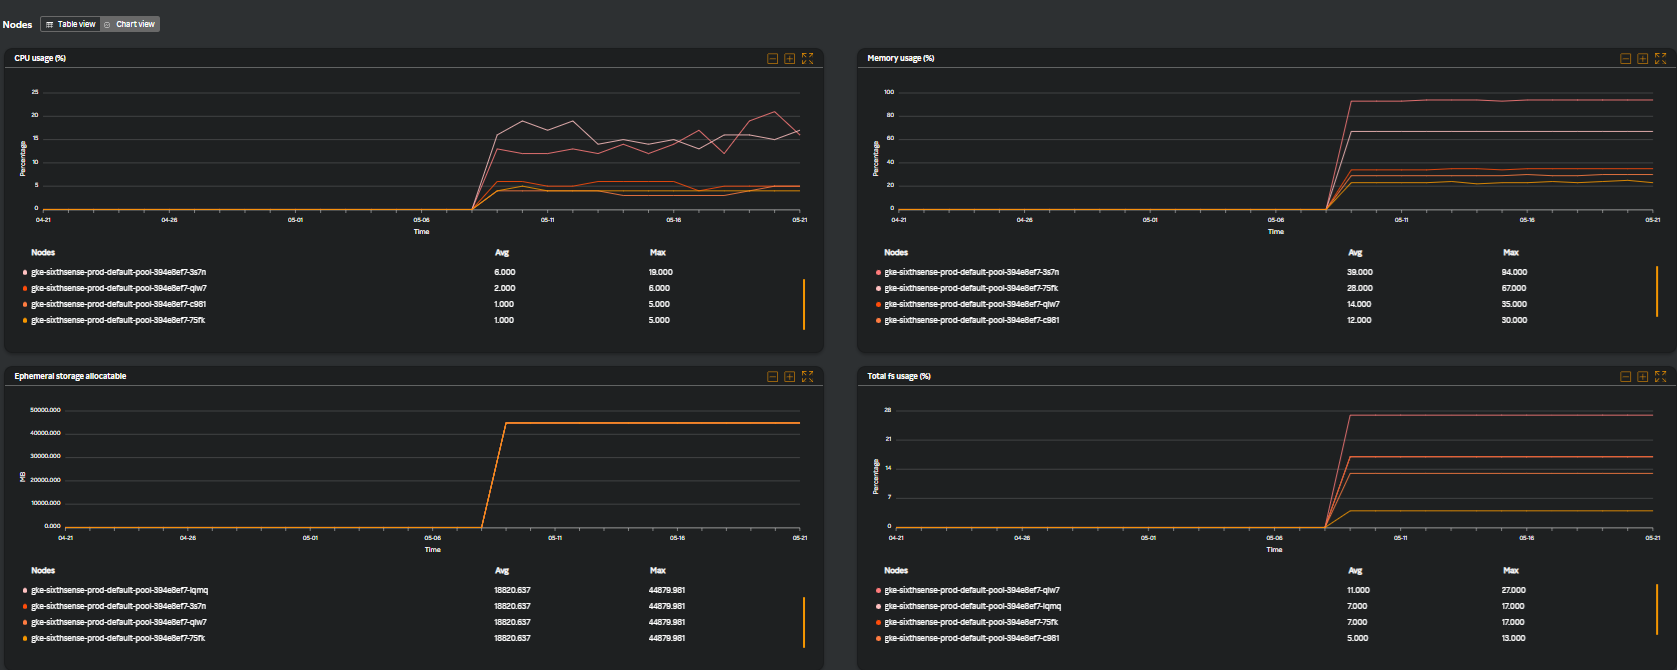
You can view the following widgets.
| Metrics | Description |
|---|---|
| CPU usage (%) | The utilized CPU resources by containers running within Kubernetes pods in percentage. |
| Memory usage (%) | The amount of memory resources consumed by containers running on Kubernetes nodes in percentage. |
| Ephemeral storage allocatable | The allocatable ephermeral storage which is a temporary storage that is attached to a pod's container. |
| Total fs usage (%) | The total usage of storage space being used within a container's filesystem. |
For managing each metric widget, see Managing widgets.
Viewing node details
Click on any node name in the table view for which you want to view the details. A screen similar to the following appears.
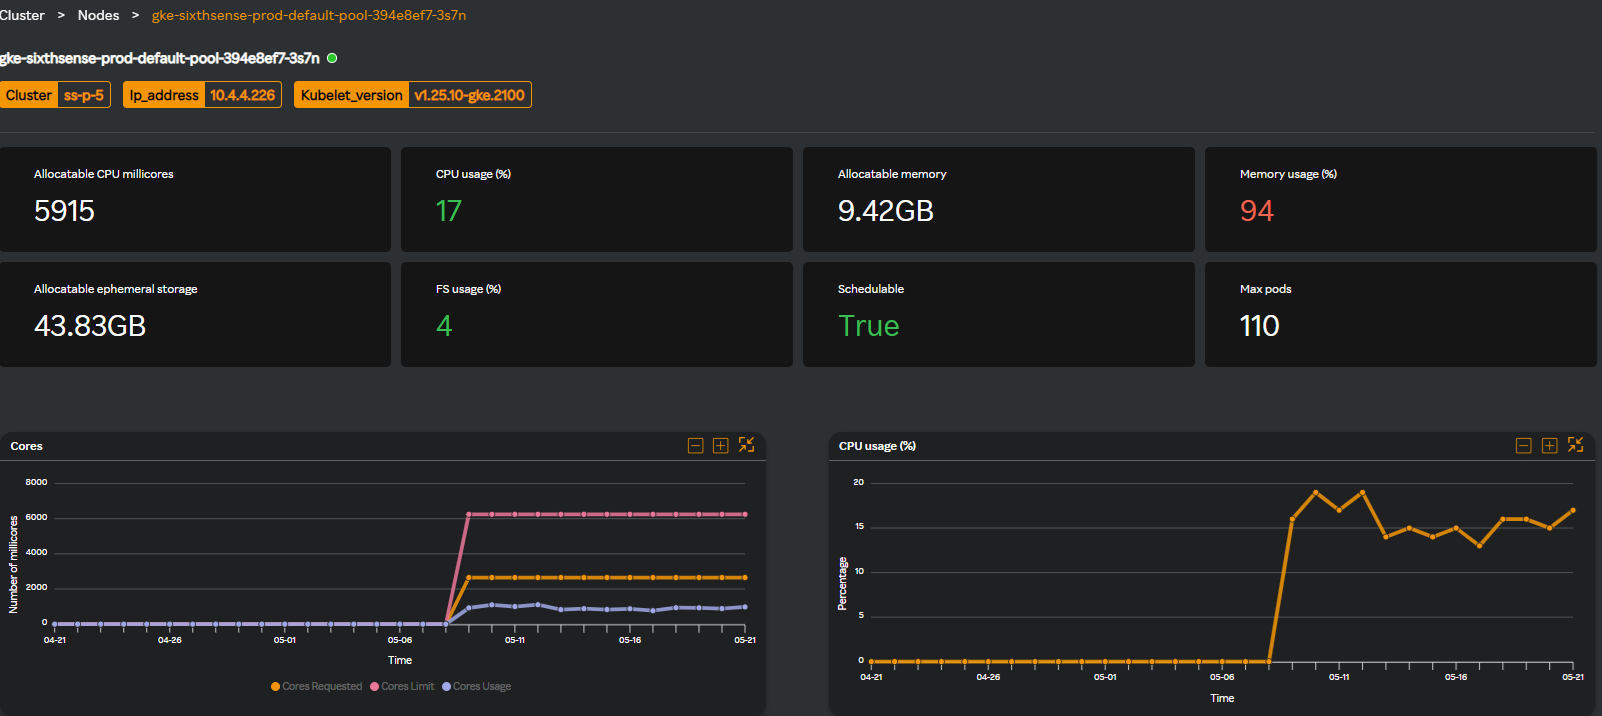
- The top header displays the cluster name, IP address, and the kubelet version of the node.
- The top pane below the header displays details of the node such as allocatable CPU millicores, CPU usage (%), allocatable memory, memory usage (%).
- The second top pane displays allocatable ephemeral storage, FS usage (%), schedulable (ready to be scheduled nodes), and maximum pods.
You can view the following widgets which displays the metrics in a graph format for the time you have specified. Hovering on each graph displays metric details and their timelines. For managing each metric widget, see Managing widgets.
- Cores
- CPU usage (%)
- Memory
- Memory usage (%)
- Network throughput
- Network I/O
- FS throughput
- FS I/O
Multi-column Filter
Nodes
- Multi-column filter can be applied on numeric columns within the Nodes Table to refine the displayed data based on specific conditions.
- When the user clicks on the “Filter by” option, user can apply filter below numeric columns
| Column Name | Description |
|---|---|
| CPU usage | Percentage of CPU currently utilized by the node. |
| Memory usage | Amount of memory used by the node, typically shown as a percentage or in MB/GB. |
| Storage | Total storage capacity used on the node. |
- Each filter condition is applied using the below operators and value ( user input based on the unit)
| Operator |
|---|
| Greater than |
| Less than |
| Equals |
| Greater than or equals |
| Less than or equals |
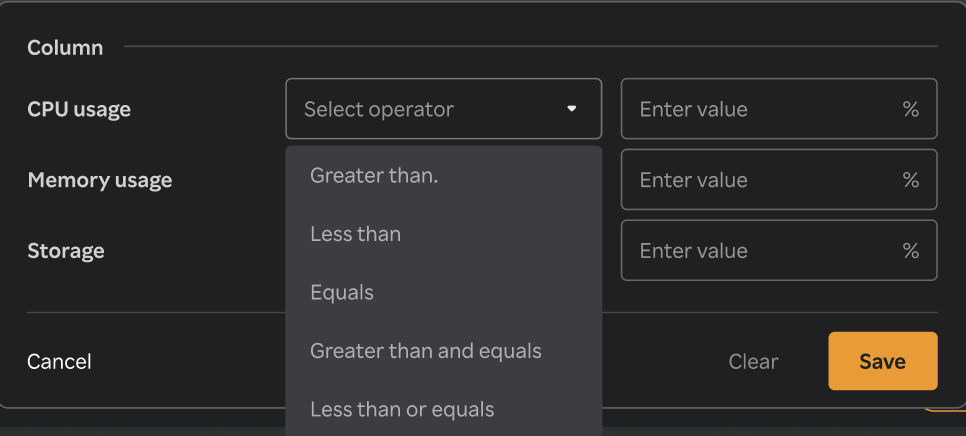
- Once filters & conditions are applied save button is enabled & click "Save" to apply the filter.
- Once filters & conditions are applied it displays no. of filters are applied.
note
- Filters are applied using AND logic — all specified conditions must be met for a record to be displayed.
- Only numeric columns support filtering; non-numeric fields (e.g., text or categorical values) are excluded from the filter options.
- If no records match the selected filters, the table will display a message such as “No data".
- The multi-column filter state persists until the user clears filters by clicking on "Clear" button when Filter by button is clicked.
- A "Reset" button is available to clear all applied filters and restore the table to its original, unfiltered state. This button is enabled only when one or more filters are currently applied.
