VM Monitoring Dashboard
The VM Monitoring home page allows you to select a group which can contain many VMs associated to a group. Grouping VMs enhances role-based access control, enables custom labeling and tagging, high-level view of system performance. You can efficiently manage and monitor large-scale VM deployments in turn gaining valuable insights into overall performance and behavior of your system.
Navigate to VM monitoring on the left pane from the SixthSense portal home page. The following VM monitoring dashboard appears.
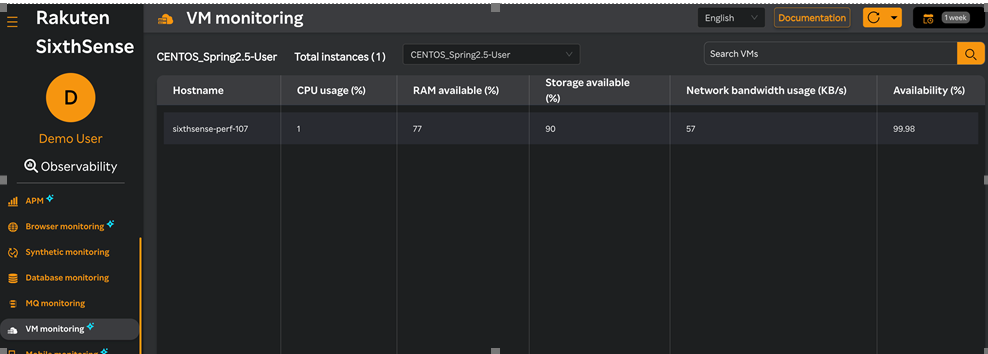
Click the drop-down list next to the Total instances field and the groups/VMs you have created are listed. Select either a Linux/Windows VM group or a VM and view a list of VMs in the Hostname column which are monitored by the SixthSense VM agent.
The number of VMs are displayed next to Total Instances.
You can enter a Linux/Windows VM name in the Search VMs field and click the ![]() icon to search for a VM.
icon to search for a VM.
The VM monitoring dashboard contains the following details in columns for both Linux/Windows VMs.
- Hostname – Host name or the custom name configured while installing the agent.
- CPU usage(%) – shows the % of CPU usage on the host.
- RAM available(%) – Shows the RAM memory available on the host.
- Storage available(%) – Total disk space available.
- Network bandwidth usage(KB/s) – The network bandwidth usage.
- Availability(%) - Availability of VMs.
Dashboard for Linux VMs
Click on a VM name listed under the Hostname column in the VM monitoring dashboard to get more details related to the selected Linux VM.
The widgets that appear in the VM dashboard are described below. You can expand, contract, and reset the view to the default timeline by clicking the icons available on the top right corner of the widgets. For more information about performing various actions, see Working with a widget in Managing Dashboards.
Performance Summary
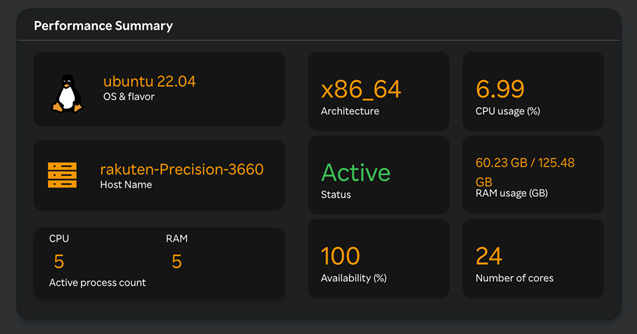
This card refers to a high-level overview of the VMs health, resource usage and so on. It provides key metrics and insights to help IT teams assess the VM’s operational state, detect issues, prevent downtime, enhance overall system health, and optimize performance. Key components of the VM performance summary include the OS and flavor used, its architecture, hostname, CPU usage, status of the VM including its RAM usage and availability in %, number of cores and active process count.
CPU average used (%)
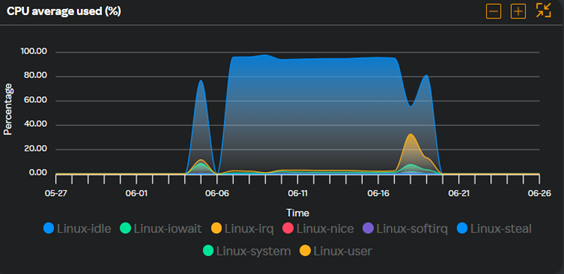
This widget represents the percentage of CPU resources consumed over a specific period. It helps track CPU load, efficiency, improve application performance, and potential performance bottlenecks within a VM.
By analyzing CPU trends, IT teams can optimize workloads, prevent slowdowns, and ensure efficient VM operations.
CPU load average
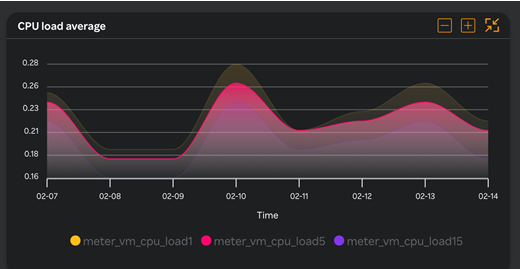
This key performance metric represents the average number of processes waiting in queue for CPU execution over a specific time period making it crucial for capacity planning, performance tuning, and system health monitoring.
The graph displays CPU load average usage on the host and it is based on CPU load breakdowns such as meter_vm_cpu_load usage.
Memory ram (MB)
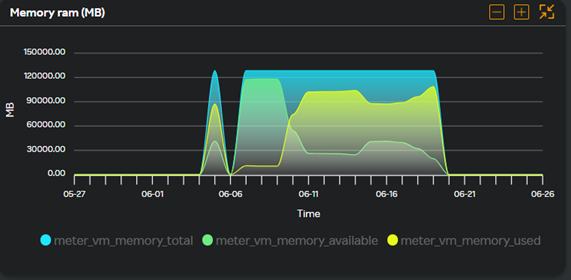
This metric refers to the amount of Random Access Memory (RAM) allocated, used, and available within a Virtual Machine (VM).
The graph in the widget represents RAM memory usage in MB on the host, and it is based on Memory load breakdowns such as Total memory, available memory and used memory usage which helps ensure optimal performance, prevent slowdowns, and avoid memory-related crashes.
By keeping an eye on RAM metrics, IT teams can ensure smooth operations, prevent swapping, and improve VM efficiency.
Memory swap (MB)
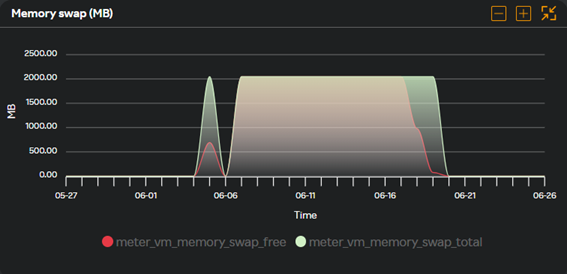
This metric refers to the process where the operating system moves data from RAM (Random Access Memory) to disk-based swap space when physical RAM is full. This helps prevent application crashes but can severely impact performance because swap memory is much slower than RAM. The graph in this widget presents swap memory usage with breakdowns of swap memory free and swap memory total.
By monitoring swap activity, IT teams can optimize RAM usage, improve system performance, and avoid unnecessary slowdowns.
File system mount point usage (%)
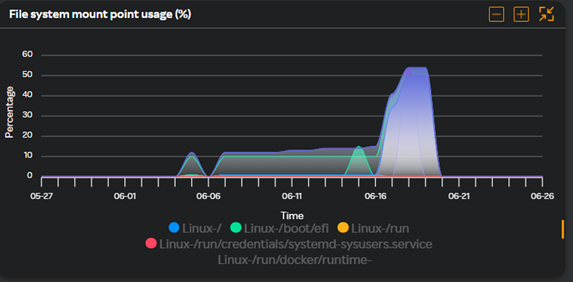
This metric refers to the amount of disk space used versus available at specific mount points where storage devices are attached to the VM’s filesystem.
Monitoring mount point usage is crucial to prevent disk space exhaustion, which can lead to system slowdowns, application failures, and data corruption.
The graph in this widget presents space usage based on volume present on the host. By monitoring usage, IT teams can optimize storage, avoid downtime, and maintain VM stability.
Disk R/W (KB/s)
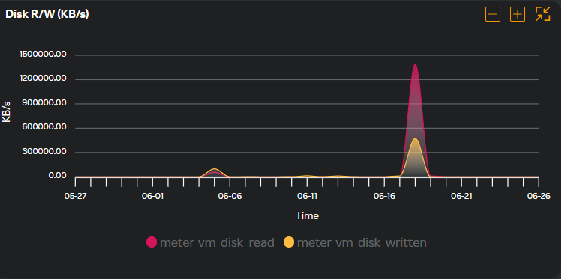
This metric refers to the rate at which data is read from and written to the disk storage by the VM.
The graph in this widget presents Read and Writes on the disk in KBs.
Monitoring disk read/write performance is crucial to identifying bottlenecks, slow I/O performance, and potential hardware issues that can impact the overall system speed. IT teams can ensure smooth VM operation and prevent bottlenecks by monitoring throughput, latency, and queue length.
Network status
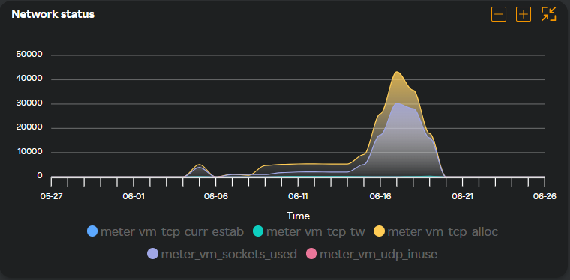
This metric refers to the overall health, performance, and connectivity of a virtual machine’s network.
The graph in this widget presents Network usage breakdown to connection status like established estab, tcp_tw, TCP_alloc, sockets_used, udp_in use to ensure smooth communication between the VM and other network resources.
By tracking latency, packet loss, bandwidth, and errors, IT teams can detect and resolve network bottlenecks before they impact applications.
Network bandwidth usage (KB/s)
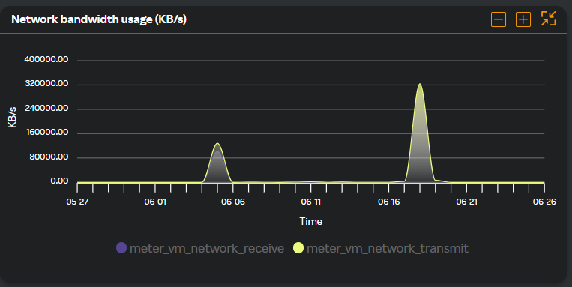
This metric refers to the amount of data transmitted over the network.
The graph in this widget presents Network bandwidth in KBs received and transmitted.
It helps track how much network capacity a VM is consuming, ensuring smooth communication and preventing congestion or performance degradation.
Filefd allocated
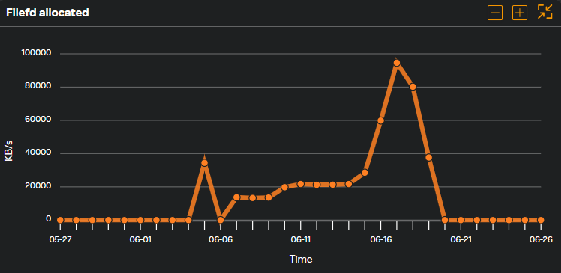
The graph in this widget presents files allocated for a VM in KBs which represents the number of file descriptors assigned to processes within a VM. Effective monitoring and configuration of filefds help prevent application failures, optimize performance, and avoid resource exhaustion.
Process CPU usage summary
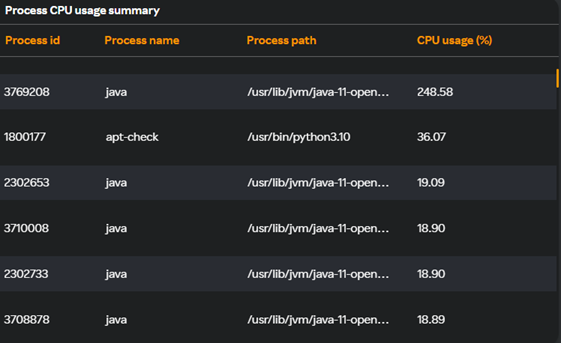
This is a single tabular card that shows the process id, process name, process path, and current CPU usage in percentage. This card aggregates data on the CPU time consumed by individual processes running on a virtual machine. This helps identify which processes are using the most CPU resources and if any could be causing performance bottlenecks.
Process RAM usage summary
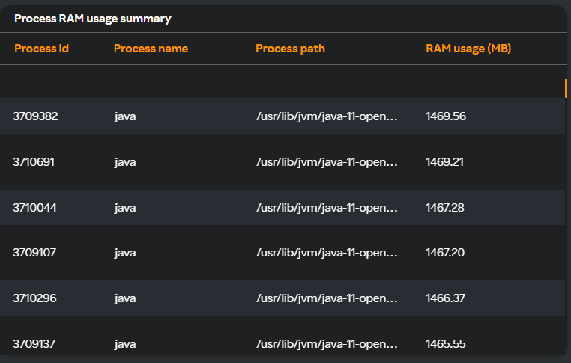
There is a single tabular card that shows the process id, process name, process path, and current RAM usage in MB on the host. This card aggregates the memory consumption data across all the processes running on a virtual machine. This summary provides a high-level view of how much memory each process consumes.
Multi-column Filter
- Multi-column filter can be applied on numeric columns within the VM Monitoring Table to refine the displayed data based on specific conditions.
- When the user clicks on the “Filter by” option, user can apply filter below numeric columns
| Column name | Description |
|---|---|
| CPU usage (%) | Percentage of CPU currently utilized on the host. |
| RAM available (%) | Percentage of RAM memory available on the host. |
| Storage available (%) | Total disk space available on the host. |
| Network bandwidth usage (KB/s) | Network bandwidth usage, measured in kilobytes per second. |
| Availability (%) | Availability status of the virtual machines (VMs). |
- Each filter condition is applied using the below operators and value ( user input based on the unit)
| Operator |
|---|
| Greater than |
| Less than |
| Equals |
| Greater than or equals |
| Less than or equals |
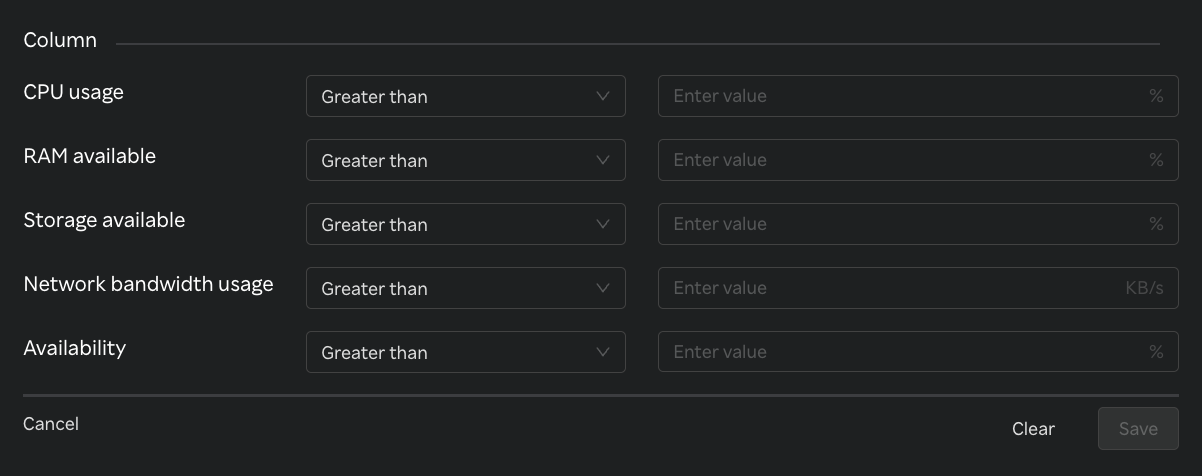
- Once filters & conditions are applied save button is enabled & click "Save" to apply the filter.
- Once filters & conditions are applied it displays no. of filters are applied.

note
- Filters are applied using AND logic — all specified conditions must be met for a record to be displayed.
- Only numeric columns support filtering; non-numeric fields (e.g., text or categorical values) are excluded from the filter options.
- If no records match the selected filters, the table will display a message such as “No data".
- The multi-column filter state persists until the user clears filters by clicking on "Clear" button when Filter by button is clicked.
- A "Reset" button is available to clear all applied filters and restore the table to its original, unfiltered state. This button is enabled only when one or more filters are currently applied.

Dashboard for Windows VMs
Click on a VM name listed under the Hostname column in the VM monitoring dashboard to get more details related to the selected Windows VM.
The widgets that appear in the VM dashboard are described below. You can expand, contract, and reset the view to the default timeline by clicking the icons available on the top right corner of the widgets. For more information about performing various actions, see Working with a widget in Managing Dashboards.
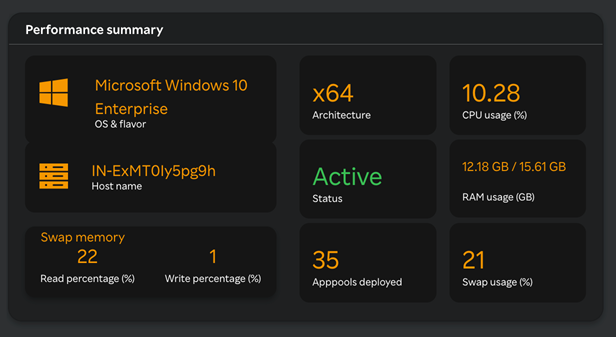
Performance Summary
The Performance Summary card contains information related to the Windows VM as follows.
| Card name | Description |
|---|---|
| OS & Flavor | This card provides the information related to server flavor. |
| Architecture | This card provides the information related to server architecture. |
| CPU Usage (%) | This card provides information related to CPU usage. |
| Hostname | The host name of the VM where agent is installed. |
| Status | This card provides information of the VM where the agent is installed as Active/InActive. These metrics are defined based on last 5 minutes of data. If the agent data is not present for last 5 minutes or more, then the VM is considered as InActive. If not, it is considered as Active. |
| Ram Usage (GB) | This card represents the RAM memory usage on the host in GBs. |
| Swap Memory | This card represents the % reads and writes on to the swap memory. |
| Apppools Deployed | This card represents the number of App Pools deployed on IIS on the host. |
| Swap Usage (%) | This card represents the amount of disk space used as a substitute for RAM when the system runs out of physical memory. |
The widgets that appear in the VM dashboard are described below. You can expand, contract, and reset the view to the default timeline by clicking the icons available on the top right corner of the widgets. For more information about performing various actions, see Working with a widget in Managing Dashboards.
Disk utility
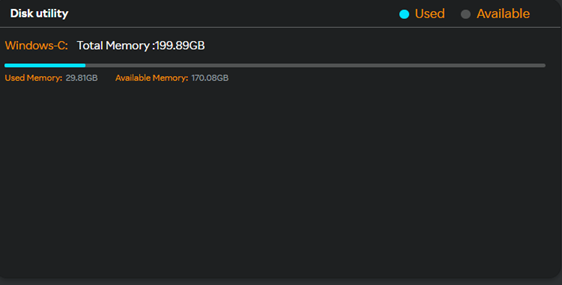
This refers to the set of metrics and tools used to assess the performance and health of disk resources attached to a virtual machine.
This card displays the used and available memory for a particular disk attached to a VM.
CPU usage (%)
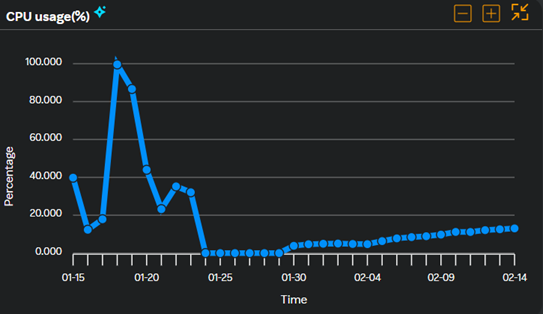
The CPU usage metric measures the percentage of the processor's capacity that's being used at any given time. This metric typically reflects the load by capturing the % Processor Time performance counter.
Memory usage (RAM)
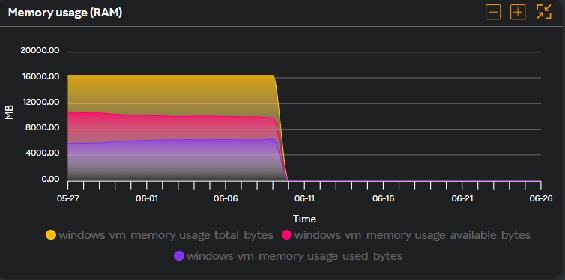
This metric refers to the amount of physical system memory (RAM) that is being used by the operating system and running processes. It is measured by values such as available bytes, total bytes, and bytes used.
This is helpful for identifying performance bottlenecks, aids in capacity planning and system tuning.
Storage available (%)
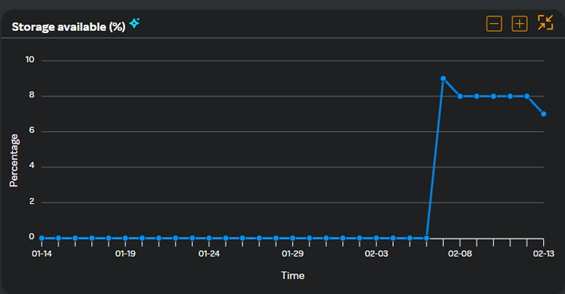
This metric refers to the free disk space on the VM’s drives. You track metrics such as the percentage of free space available to ensure the system doesn't run out of disk capacity.
Monitoring the disk space supports proactive alerting and capacity planning by identifying trends in disk usage, prevents application and OS failures caused by insufficient space and so on.
Network bandwidth usage (KBs)
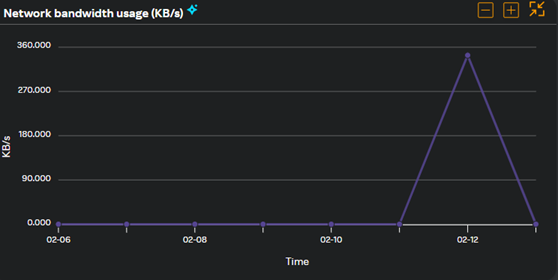
This metric measures the volume of data transmitted to and from a VM over time in kilobytes. It captures both incoming and outgoing traffic on the network adapter.
This helps in assessing performance, capacity planning, security monitoring, and diagnose network related issues.
System & User CPU usage
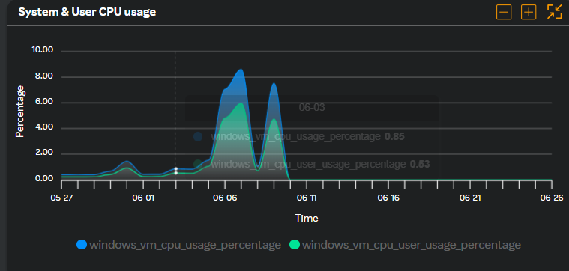
System CPU Usage represents the percentage of CPU resources used by the operating system's kernel and core system processes while the User CPU Usage measures the CPU resources consumed by user applications and processes running on the VM.
This metric helps troubleshoot high CPU usage issues, unexpected workload spikes, optimize resource allocation, analyze performance, and so on.
Disk R/W (KB/s)
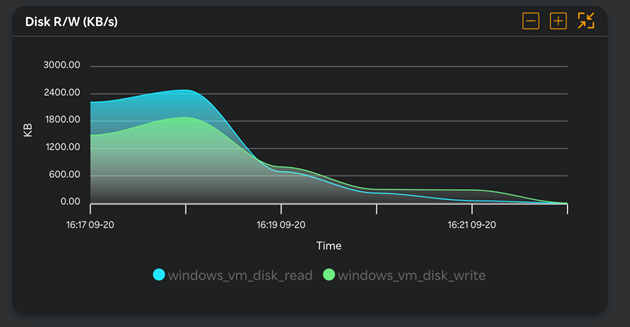
Disk R/W monitoring tracks the read and write operations on your VM’s storage devices. This metric helps identify bottlenecks due to slow disk operations, identify issues such as disk latency, enable setting up alerts for abnormal disk activity and so on.
Network packet status
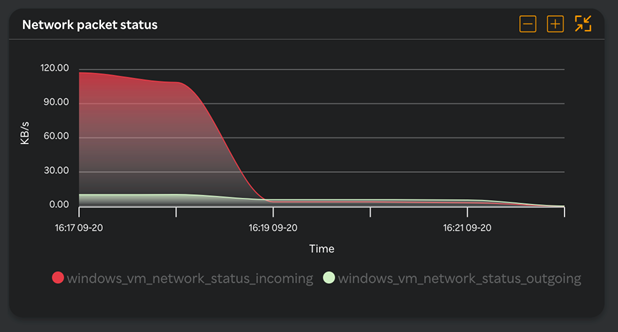
This metric refers to the tracking of network packet events such as packet captures, drops, or errors that occur on a VM's network interface.
It helps analyze the packet flow to ensure data is transmitted efficiently without loss or delays,supports maintaining network stability and overall VM performance and so on.
CPU usage/app process
CPU usage measures the percentage of processing power a Windows VM is using at any given time and helps determine if the system is overburdened or if resources are available for more workload.
This metric provides a comprehensive view of your Windows VM’s performance, helping you identify potential bottlenecks, optimize your system, and ensure that the proper processes receive the necessary resources.
Worker set/app process
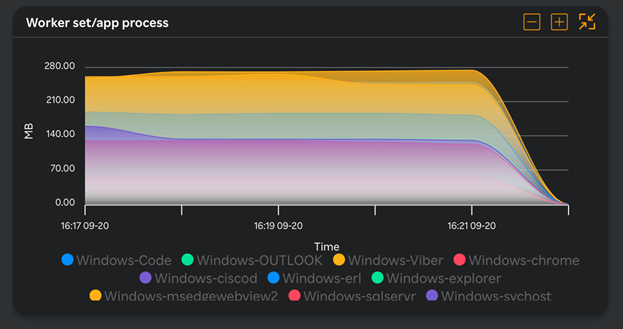
The Worker Set represents the total amount of physical memory (RAM) that a process is currently using and App process monitoring focuses on tracking the performance of individual processes running on a Windows VM.
Each of these metrics works together to provide a comprehensive view of your Windows VM's performance, allowing you to diagnose resource issues, optimize application performance, and plan capacity effectively.
Worker process/app process
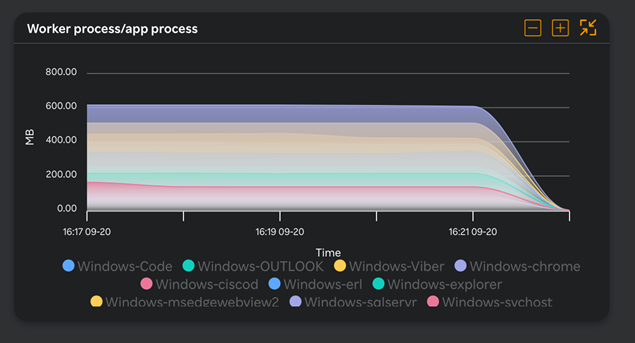
Monitoring worker processes involves tracking metrics such as CPU usage, memory consumption, and request handling times to ensure optimal performance and identify issues and app processes involves tracking their performance metrics, such as CPU and memory usage, to ensure they are functioning correctly and efficiently.
This metric ensures optimal performance, identify issues, and identifies resource-intensive applications that may affect overall system performance.
Application pool events
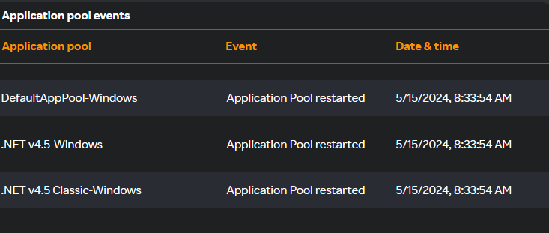
This metric provides insights into the performance of web applications hosted on IIS. Monitoring these events helps identify performance bottlenecks, resource usage patterns, allows administrators to quickly detect when an application pool crashes or is not responsive, optimize resource allocation and load balancing across multiple application pools and so on.
Multi-column Filter
- Multi-column filter can be applied on numeric columns within the VM Monitoring Table to refine the displayed data based on specific conditions.
- When the user clicks on the “Filter by” option, user can apply filter below numeric columns
| Column name | Description |
|---|---|
| CPU usage (%) | Percentage of CPU currently utilized on the host. |
| RAM available (%) | Percentage of RAM memory available on the host. |
| Storage available (%) | Total disk space available on the host. |
| Network bandwidth usage (KB/s) | Network bandwidth usage, measured in kilobytes per second. |
| Availability (%) | Availability status of the virtual machines (VMs). |
- Each filter condition is applied using the below operators and value ( user input based on the unit)
| Operator |
|---|
| Greater than |
| Less than |
| Equals |
| Greater than or equals |
| Less than or equals |
- Once filters & conditions are applied save button is enabled & click "Save" to apply the filter.
- Once filters & conditions are applied it displays no. of filters are applied.
note
- Filters are applied using AND logic — all specified conditions must be met for a record to be displayed.
- Only numeric columns support filtering; non-numeric fields (e.g., text or categorical values) are excluded from the filter options.
- If no records match the selected filters, the table will display a message such as “No data".
- The multi-column filter state persists until the user clears filters by clicking on "Clear" button when Filter by button is clicked.
- A "Reset" button is available to clear all applied filters and restore the table to its original, unfiltered state. This button is enabled only when one or more filters are currently applied.
Dashboard for Solaris VMs
Click on a VM name listed under the Hostname column in the VM monitoring dashboard to get more details related to the selected Solaris VM.
The widgets that appear in the VM dashboard are described below. You can expand, contract, and reset the view to the default timeline by clicking the icons available on the top right corner of the widgets.
Overview
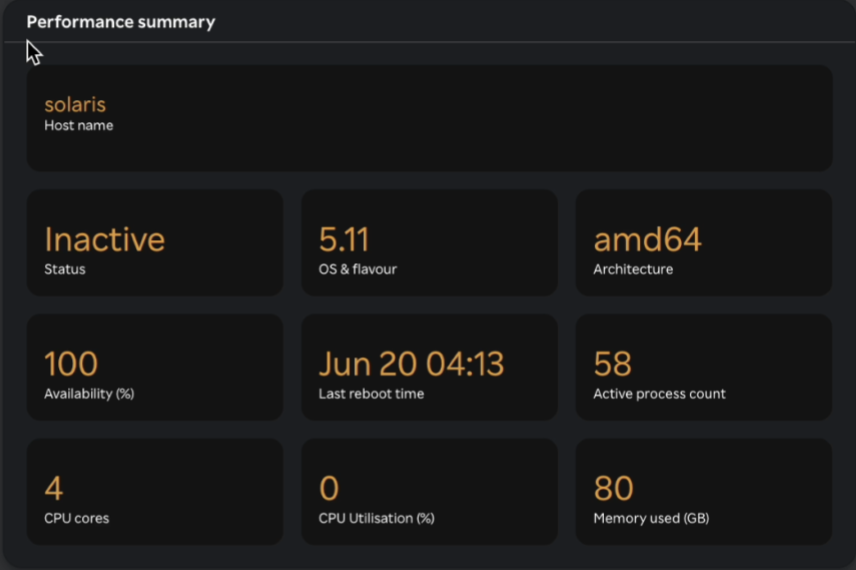
Performance Summary
The Performance Summary card contains information related to the Solaris VM as follows.
| Card name | Description |
|---|---|
| Hostname | The host name of the VM where agent is installed. |
| Status | This card provides information of the VM where the agent is installed as Active/InActive. These metrics are defined based on last 5 minutes of data. If the agent data is not present for last 5 minutes or more, then the VM is considered as InActive. If not, it is considered as Active. |
| OS & Flavor | This card provides the information related to host flavor. |
| Architecture | This card provides the information related to host architecture. |
| Availability(%) | This card provides the information related to host availability %. |
| Last reboot time | This card provided the information related to last reboot date & time. |
| Active process count | This card provides the information related to number of Active process count on the host. |
| CPU cores | This card provides the information related to number of cpu cores on this host. |
| CPU Utilisation (%) | This card provides information related to CPU usage in %. |
| Memory Used (GB) | This card represents the memory usage on the host in GBs. |
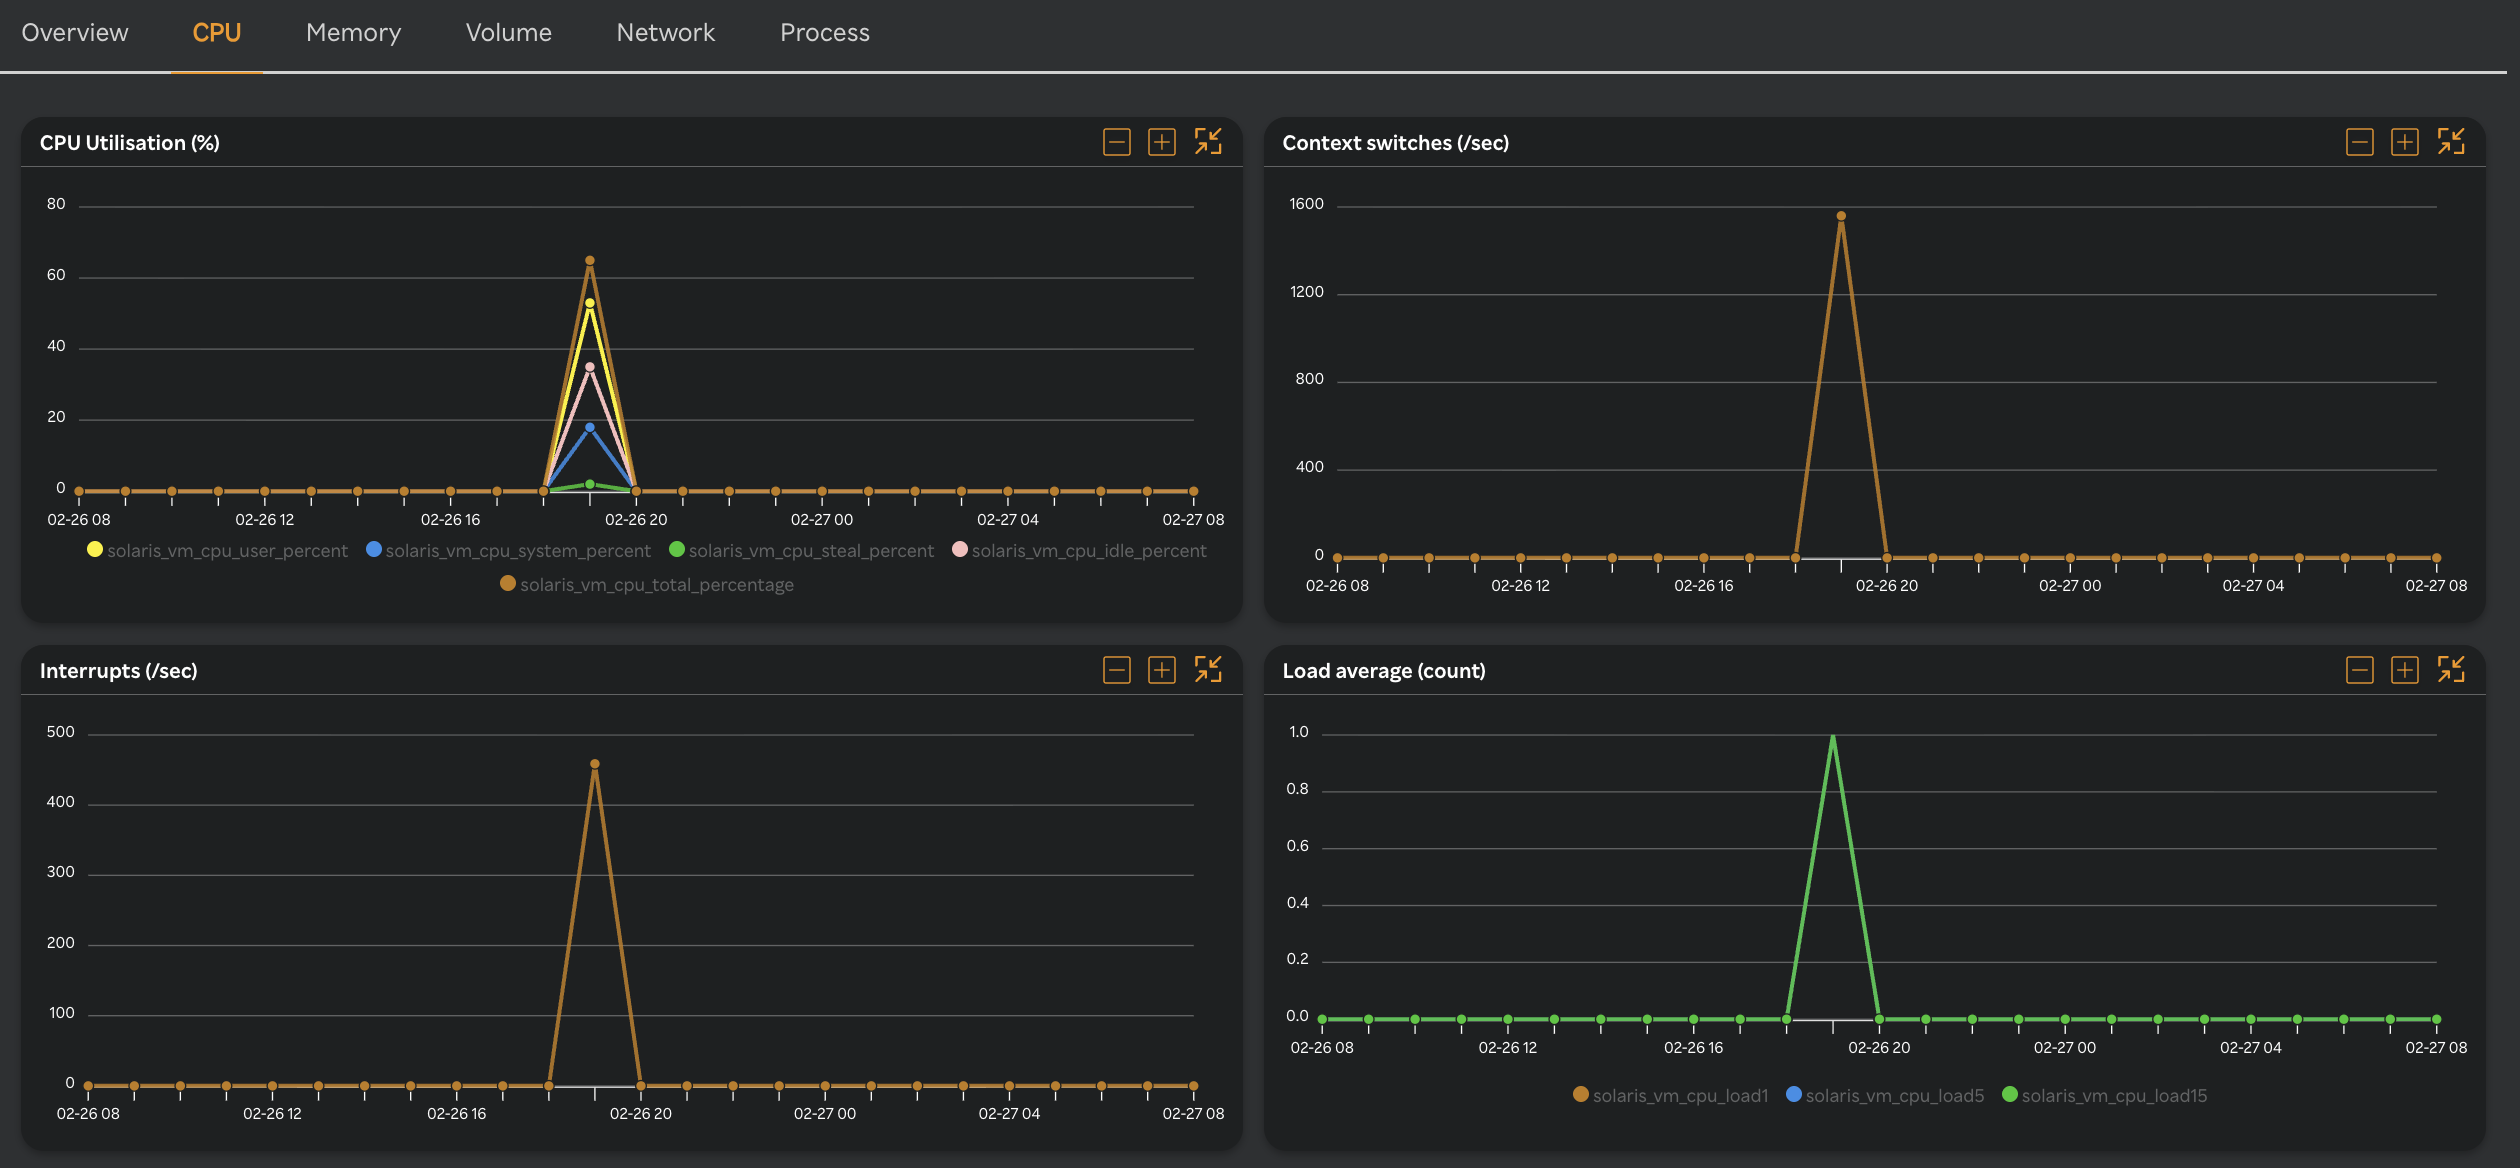
CPU
The CPU tab aggregates all metrics related to processor performance and resource consumption within the Solaris VM. It enables monitoring of CPU usage patterns, load distribution and potential bottlenecks impacting system performance.
| Metric Name | Description |
|---|---|
| CPU Utilisation (%) | Overall CPU usage including User, System, I/O Wait, Steal, and Idle time. Helps identify CPU bottlenecks. |
| Context Switches (/Sec) | Number of times the CPU switches between processes per second. High values may indicate scheduling inefficiencies. |
| Interrupts (/Sec) | Number of hardware interrupts handled by the CPU per second. High values may indicate hardware/driver issues. |
| Load Average (Count) | Average number of processes in the run queue over 1, 5, and 15 minutes (Load-1m, Load-5m, Load-15m). Key indicator of system load. |
Memory
The Memory tab provides a comprehensive view of all memory-related metrics for the Solaris virtual machine. It includes usage, allocation, paging activity, and memory pressure indicators to help monitor and troubleshoot memory performance.
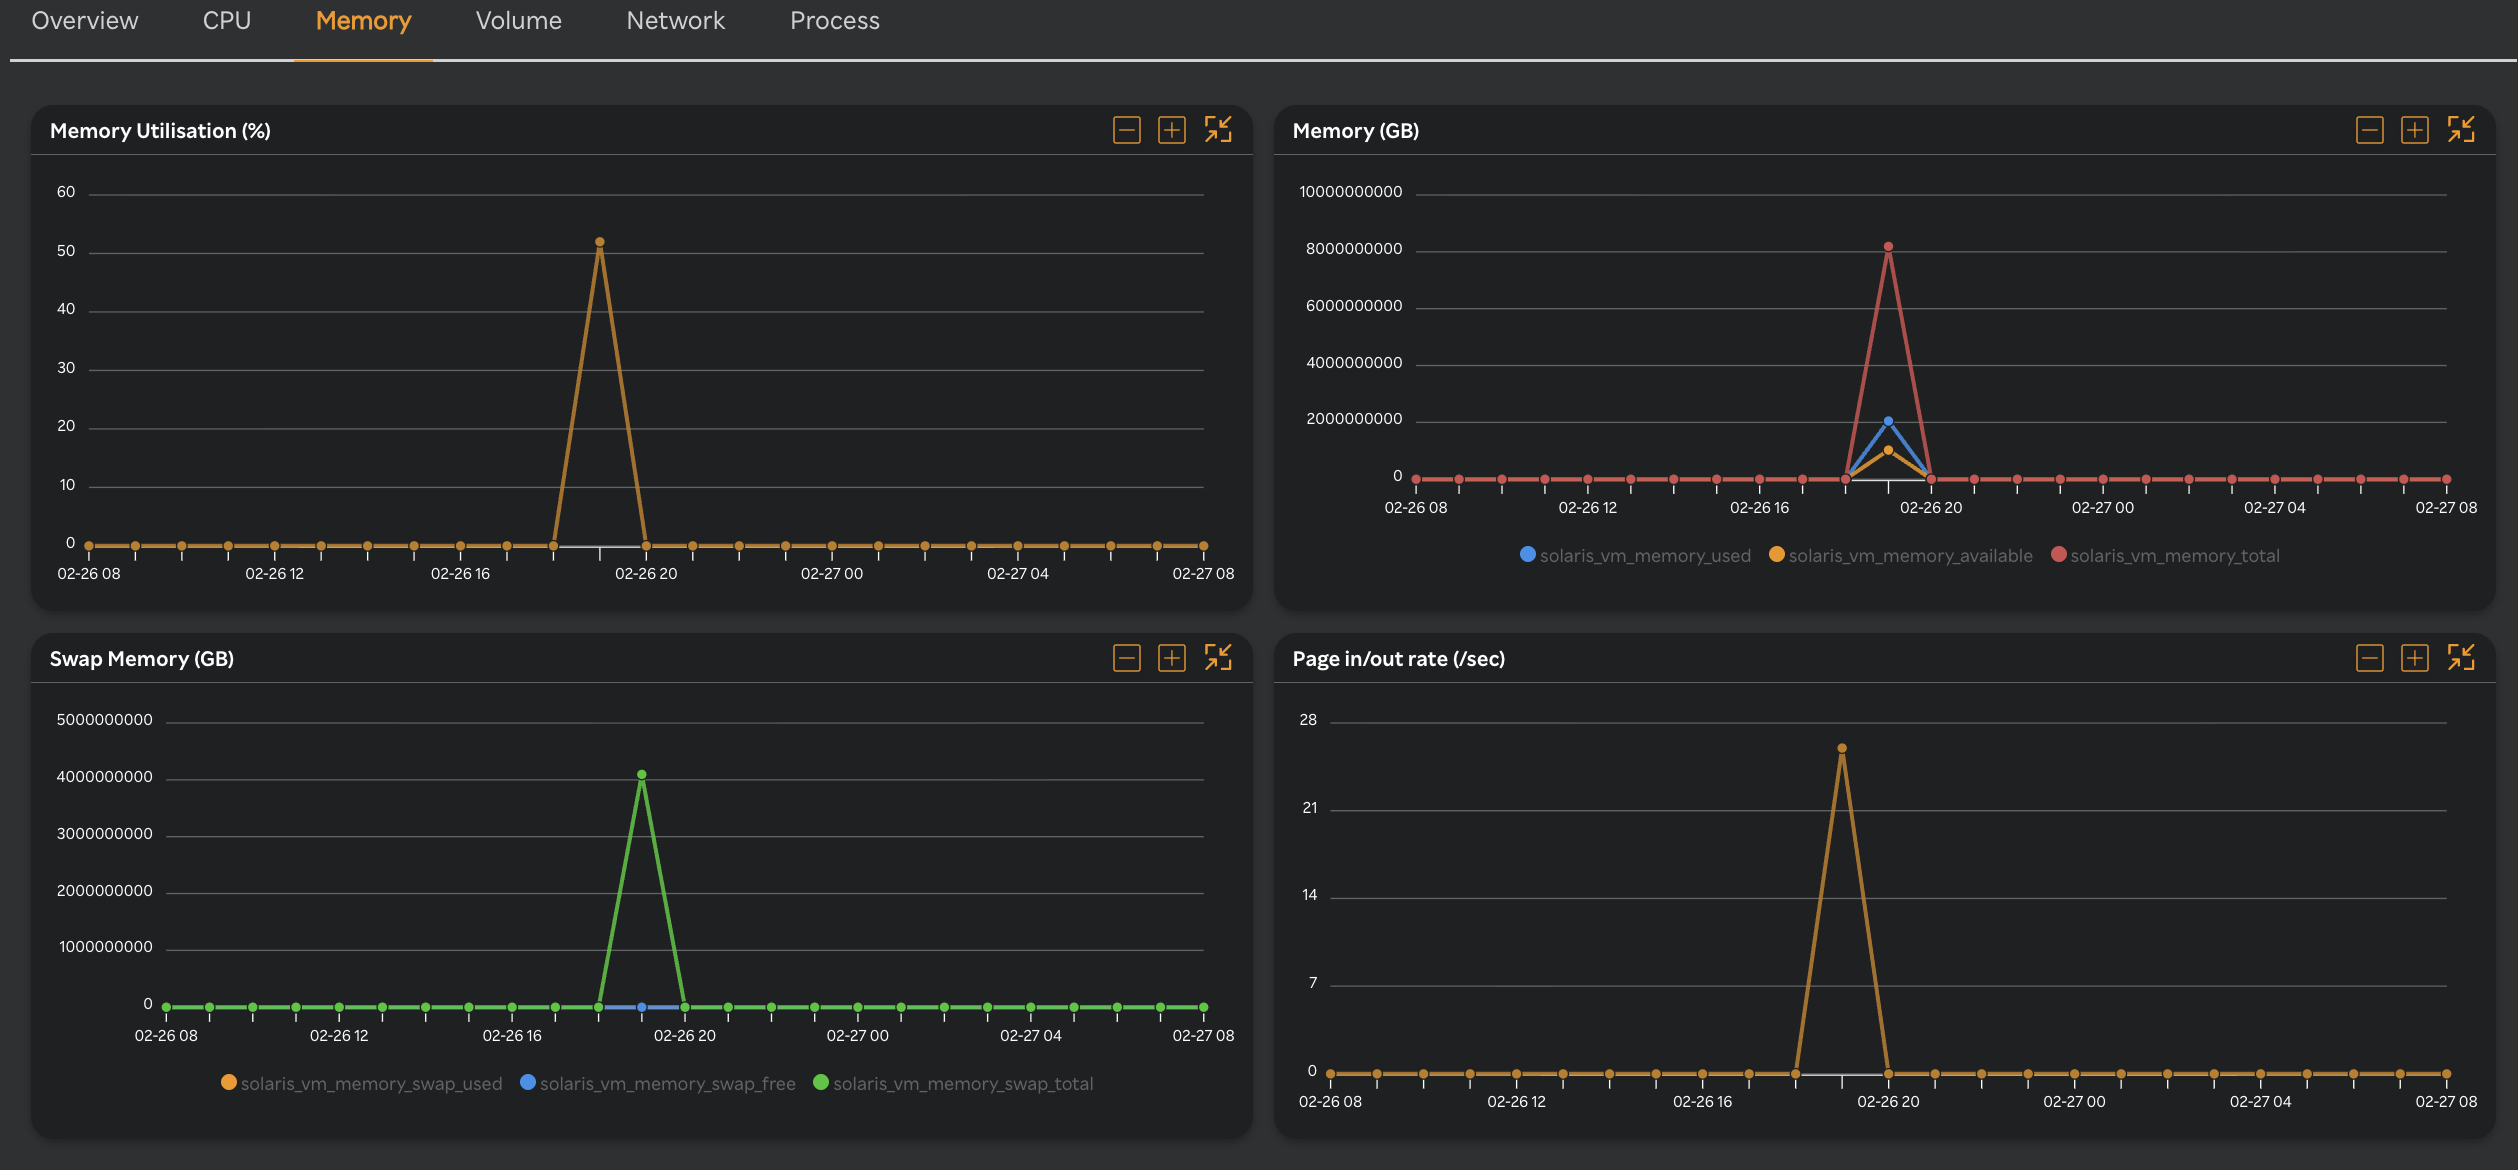
| Metric Name | Description |
|---|---|
| Memory Utilisation (%) | Percentage of physical memory currently in use. |
| Memory (GB) | Graph displaying Memory Free, Memory Used, and Memory Total. |
| – Memory Available | Physical memory currently available. |
| – Memory Used | Physical memory currently consumed. |
| – Memory Total | Total physical memory (Memory Used + Memory Free). |
| Swap Memory (GB) | Graph displaying Swap Used, Swap Free, Swap Total. |
| – Swap Used | Amount of swap space in use. Excessive usage indicates memory pressure. |
| – Swap Free | Swap space currently available. |
| – Swap Total | Total configured swap space on the system. |
| Page In/Out Rate (/Sec) | Rate of memory pages being swapped in/out per second. High rates indicate memory pressure. |
Volume
The Volume tab provides a comprehensive view of all storage volume–related metrics for the Solaris virtual machine. It includes capacity, utilization, throughput, and I/O performance indicators to help monitor and troubleshoot storage behavior.
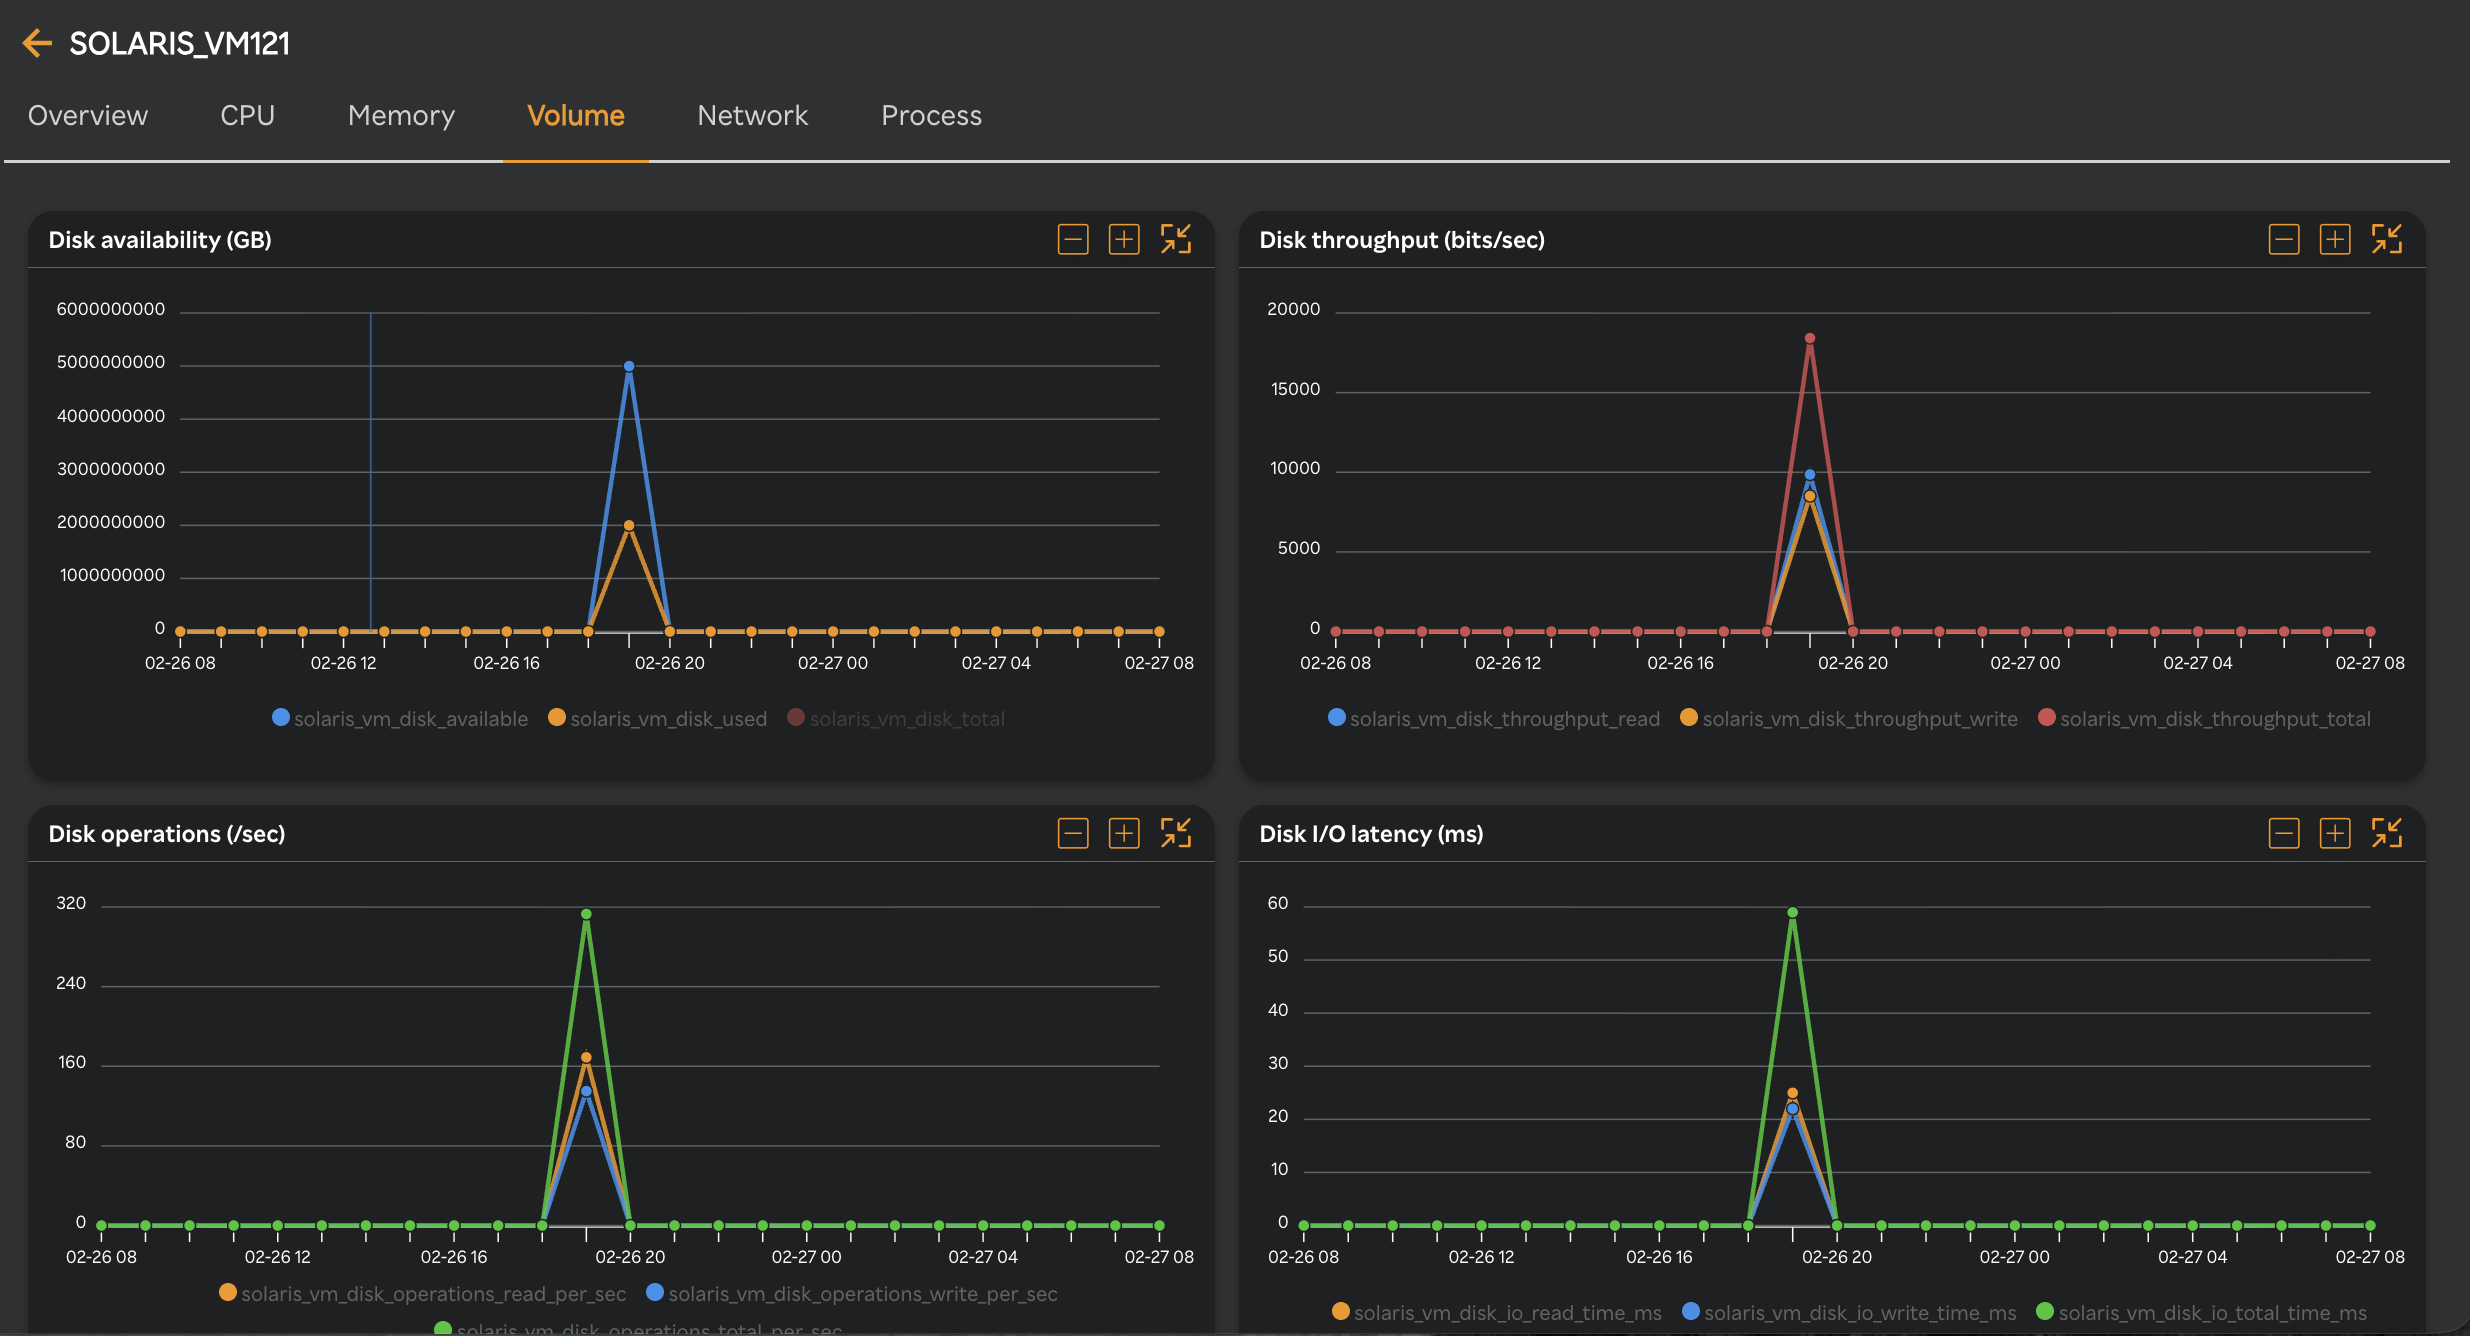
| Metric Name | Description |
|---|---|
| Disk Availability (GB) | Graph displaying Volume Used, Volume Free, Volume Total. |
| – Volume Used | Amount of storage currently used. |
| – Volume Free | Amount of storage currently available. |
| – Volume Total | Total storage capacity on the respective host. |
| Disk Throughput (Bits/Sec) | Graph displaying throughput metrics in bits per second. |
| – Throughput Read | File system read throughput in bits per second. |
| – Throughput Write | File system write throughput in bits per second. |
| – Throughput Total | Combined read/write throughput in bits per second. |
| Disk Operations (/Sec) | Graph displaying number of disk operations per second. |
| – Operations Read | Number of read operations/sec. |
| – Operations Write | Number of write operations/sec. |
| – Operations Total | Total read/write operations/sec. |
| Disk I/O Latency (ms) | Graph displaying I/O latency metrics. |
| – I/O Read Time | Average time to complete read operations (disk read latency). |
| – I/O Write Time | Average time to complete write operations (disk write latency). |
| – I/O Total Time | Average time for combined read/write operations. |
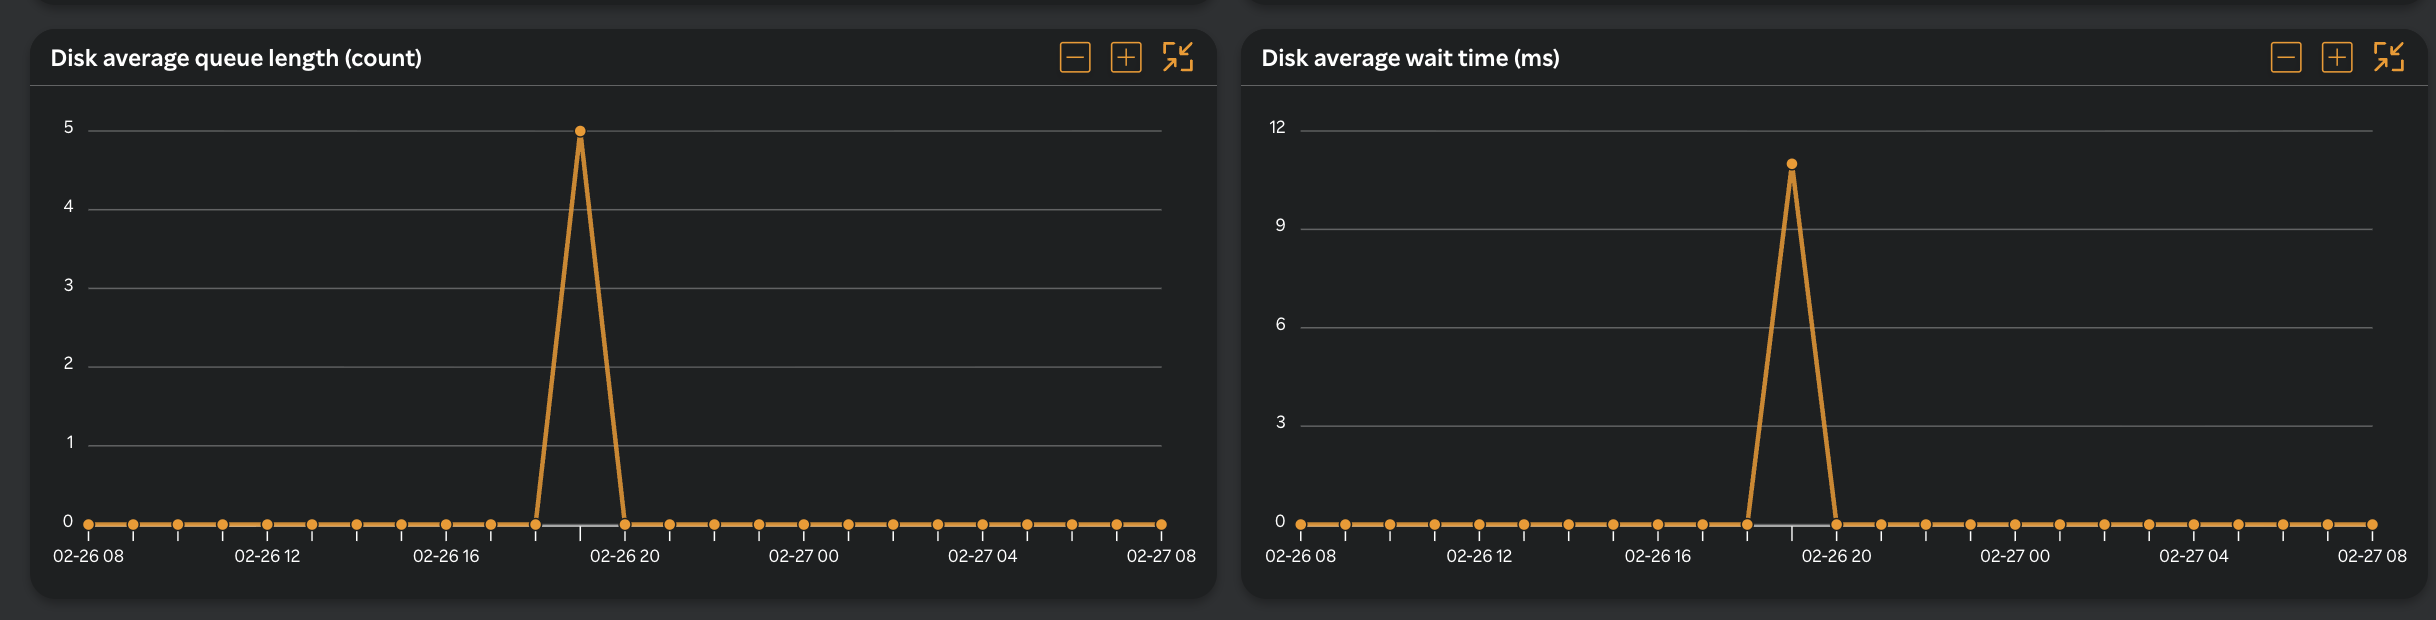
| Disk Average Queue Length (Count) | Average number of I/O requests waiting to be serviced. High values indicate disk bottlenecks. |
| Disk Average Wait Time (ms) | Average time an I/O request spends waiting in the disk queue. |
Network
The Network tab provides a comprehensive view of all network-related metrics for the Solaris virtual machine. It includes bandwidth utilization, packet statistics, traffic patterns, and error indicators to help monitor connectivity and diagnose network performance issues.
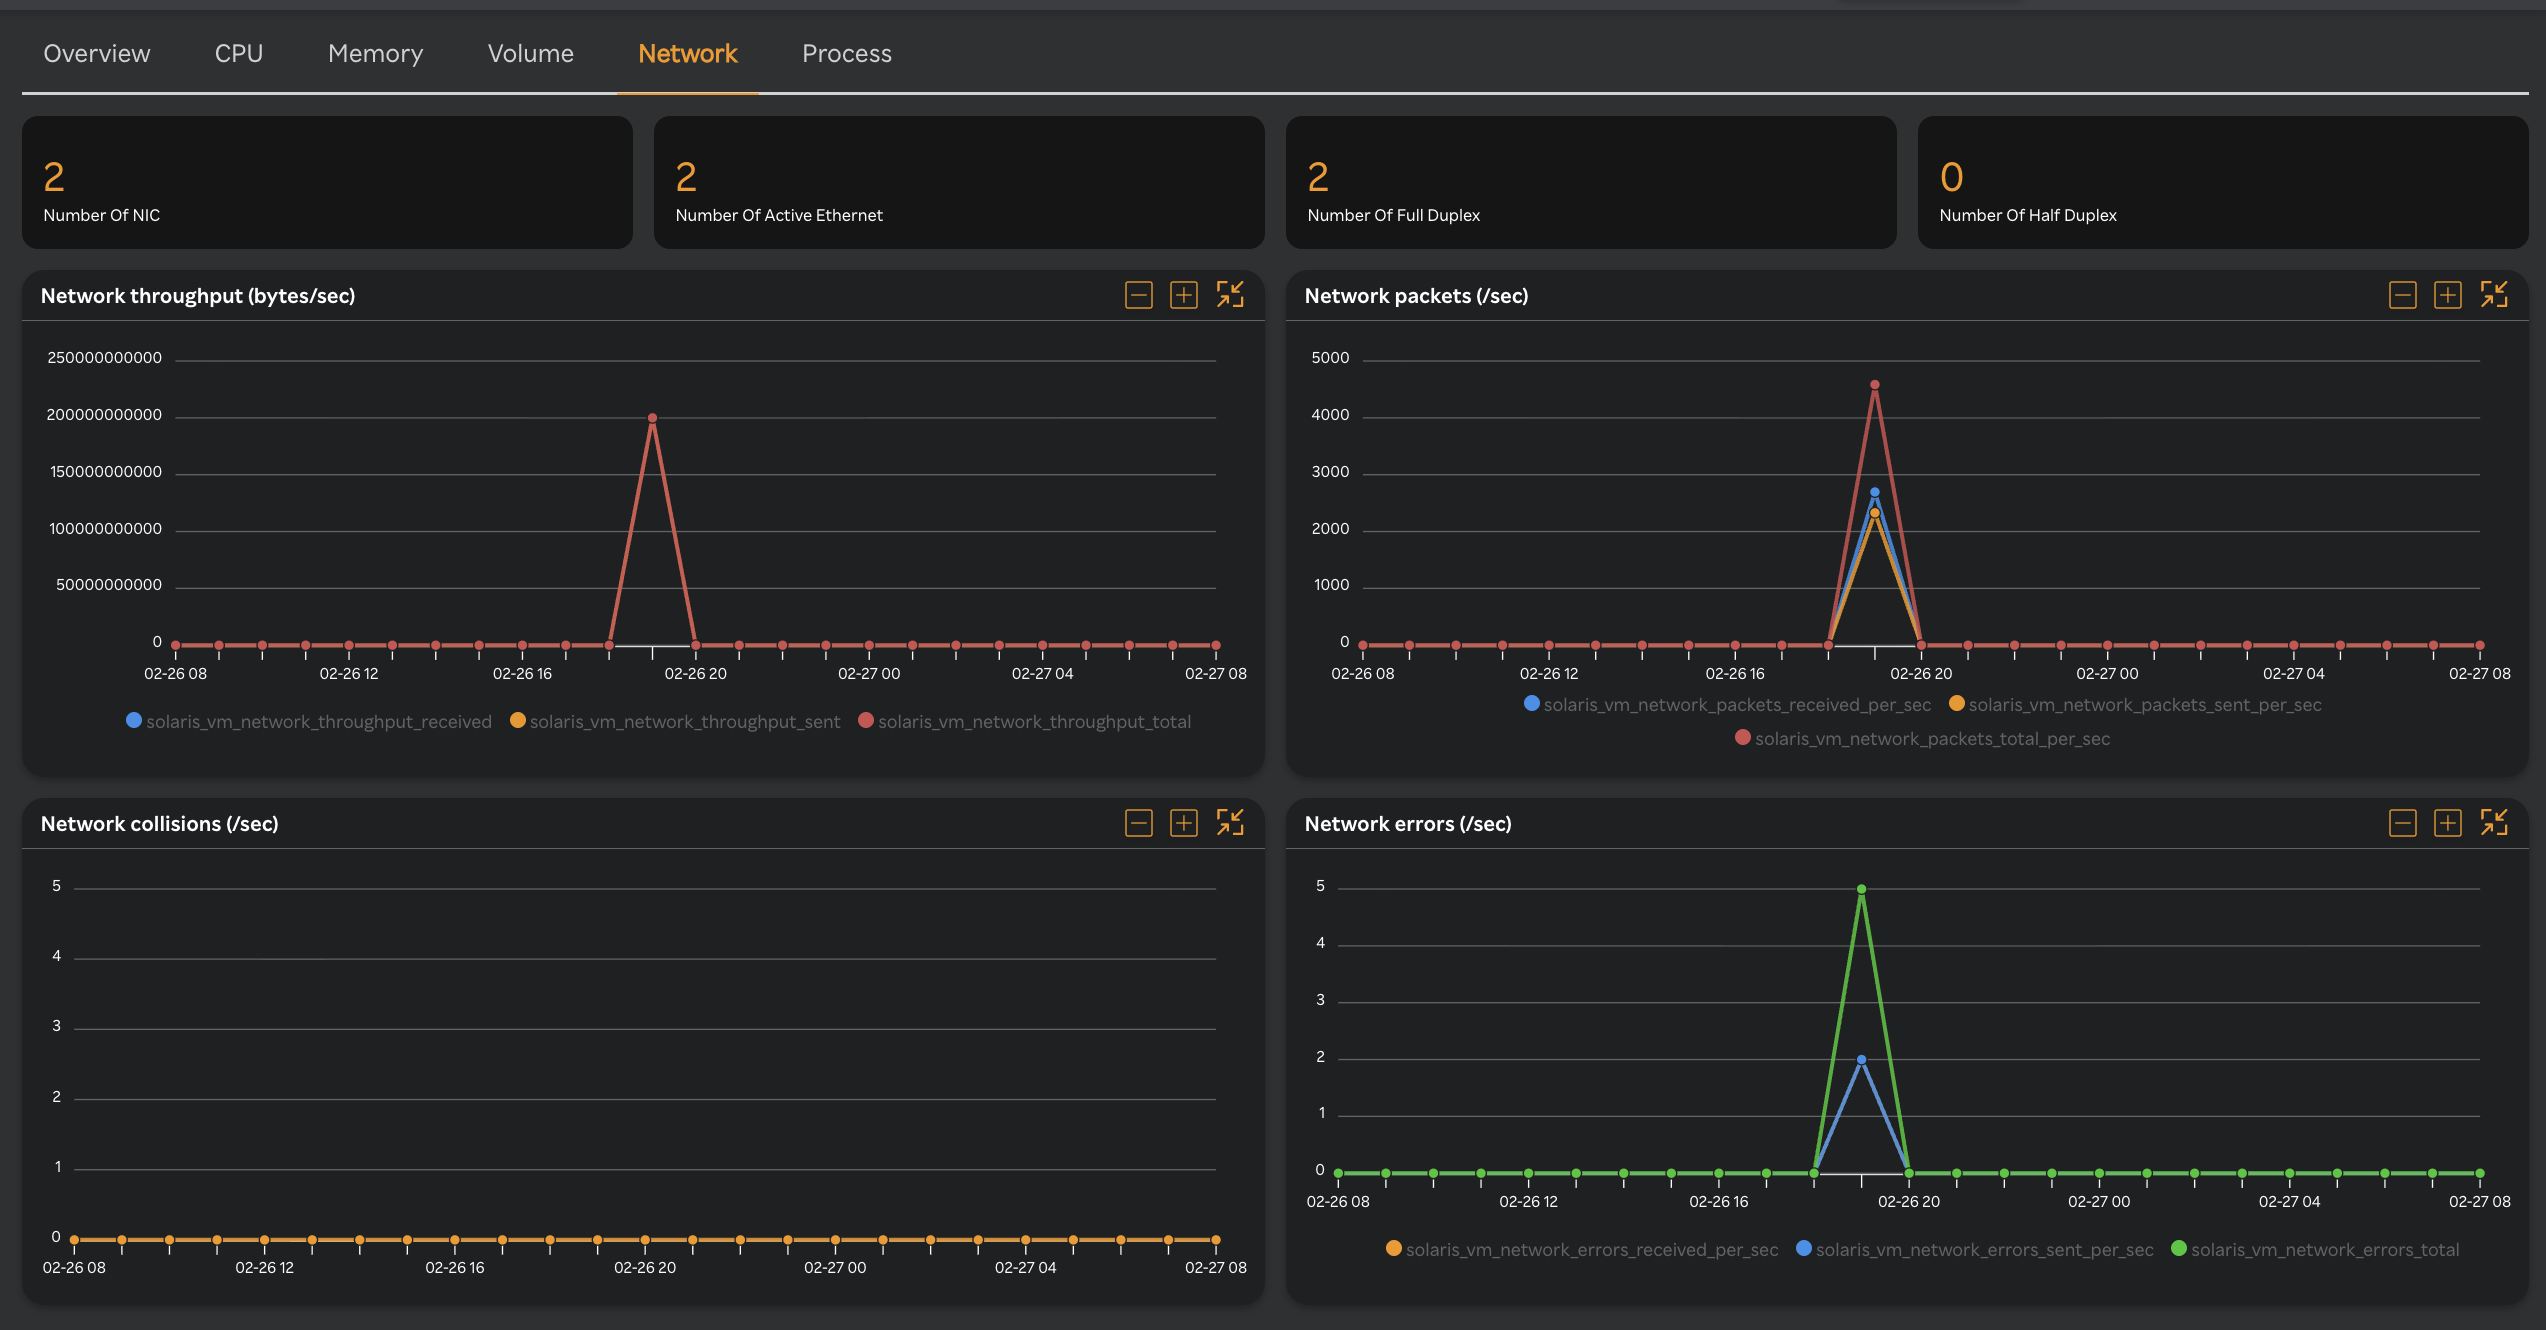
| Metric Name | Description |
|---|---|
| Number of NIC | Displays number of nic's |
| Number of Active Ethernet | Display of number of Active Ethernets |
| Number of Full Duplex | Number of Network Interfaces operating in Full Duplex mode. |
| NUmber of Half Duplex | Number of Network Interfaces operating in Half Duplex mode. |
| Network Throughput (Bytes/sec) | Graph displaying network data transfer speeds. |
| – Throughput Received | Volume of data being received over the network. |
| – Throughput Sent | Volume of data being sent over the network. |
| – Throughput Total | Total volume of data received and sent over the network. |
| Network Packets (/Sec) | Graph displaying network packet counts per second. |
| – Packets Received | Number of packets received per second. |
| – Packets Sent | Number of packets sent per second. |
| – Packets Total | Total number of packets received and sent per second. |
| Network Collisions (/Sec) | Number of network collisions per second (relevant for older Ethernet networks). High collision rates indicate network congestion. |
| Network Errors (/Sec) | Graph displaying network errors per second. |
| – Errors Received | Number of errors encountered while receiving data per second. |
| – Errors Sent | Number of errors encountered while sending data per second. |
| – Errors Total | Total number of errors encountered while sending and receiving data per second. |
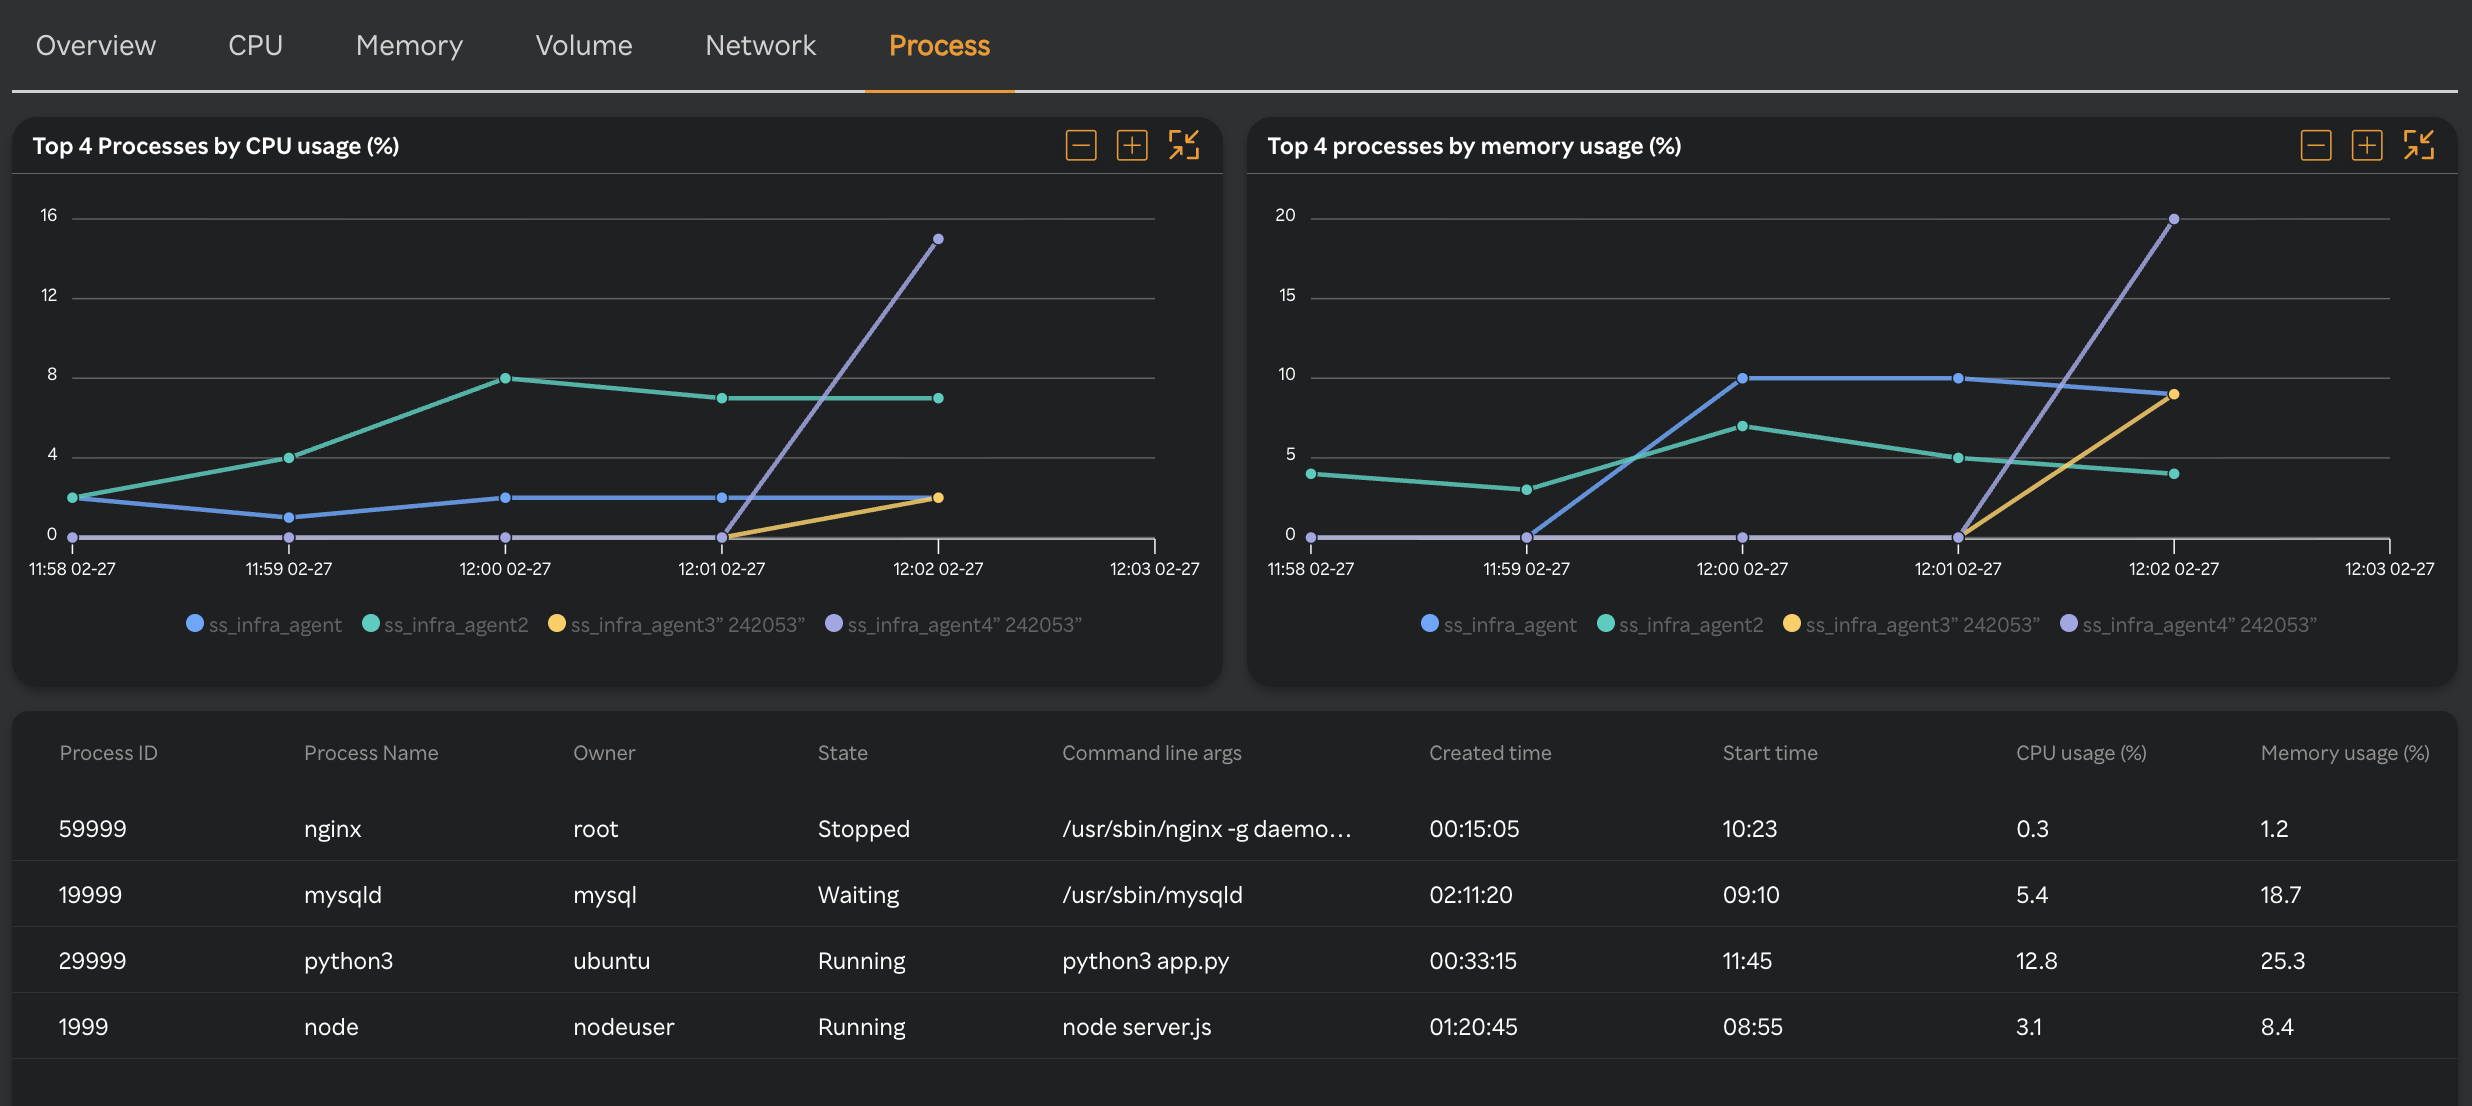
Process
The Process tab provides a comprehensive view of all process-related metrics for the Solaris virtual machine. It includes process count, CPU and memory consumption by processes, process states, and resource utilization details to help identify resource-intensive or abnormal processes affecting system performance.
| Metric Name | Description |
|---|---|
| Top N Processes by CPU usage (%) | Displays all the Top N processes by cpu usage %. "N" values depends on the number configured in config.yaml |
| Top N Processes by Memory usage (%) | Displays all the Top N processes by memory usage %. "N" values depends on the number configured in config.yaml |
| Process Overview | Table displaying key metrics for each process running on the system. |
| – Process ID | Unique identifier (PID) of the specific process. |
| – Process Name | Name of the specific process. |
| – Owner | User under which the specific process is running. |
| – Command Line Args | Parameters passed to the process at startup. |
| – Created Time | Timestamp when the process was created. |
| – Start Time | Timestamp when the process started execution. |
| – CPU Usage (%) | CPU usage of the specific process. Helps analyze CPU consumption per process. |
| – Memory Usage (%) | Memory usage of the specific process. Helps analyze memory consumption per process. |
Multi-column Filter
- Multi-column filter can be applied on numeric columns within the VM Monitoring Table to refine the displayed data based on specific conditions.
- When the user clicks on the “Filter by” option, user can apply filter below numeric columns
| Column name | Description |
|---|---|
| CPU usage (%) | Percentage of CPU currently utilized on the host. |
| RAM available (%) | Percentage of RAM memory available on the host. |
| Storage available (%) | Total disk space available on the host. |
| Network bandwidth usage (KB/s) | Network bandwidth usage, measured in kilobytes per second. |
| Availability (%) | Availability status of the virtual machines (VMs). |
- Each filter condition is applied using the below operators and value ( user input based on the unit)
| Operator |
|---|
| Greater than |
| Less than |
| Equals |
| Greater than or equals |
| Less than or equals |
- Once filters & conditions are applied save button is enabled & click "Save" to apply the filter.
- Once filters & conditions are applied it displays no. of filters are applied.
note
- Filters are applied using AND logic — all specified conditions must be met for a record to be displayed.
- Only numeric columns support filtering; non-numeric fields (e.g., text or categorical values) are excluded from the filter options.
- If no records match the selected filters, the table will display a message such as “No data".
- The multi-column filter state persists until the user clears filters by clicking on "Clear" button when Filter by button is clicked.
- A "Reset" button is available to clear all applied filters and restore the table to its original, unfiltered state. This button is enabled only when one or more filters are currently applied.