Kafka dashboard
Navigate to MQ monitoring on the left pane in the Observability portal.
By default, the Overview tab is selected.
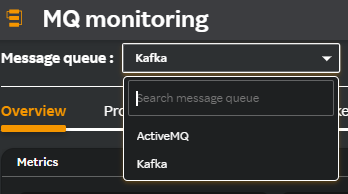
Select Kafka from the Message queue drop-down list as in the following screen.
- Select a service from the Service name drop-down list as in the following screen.
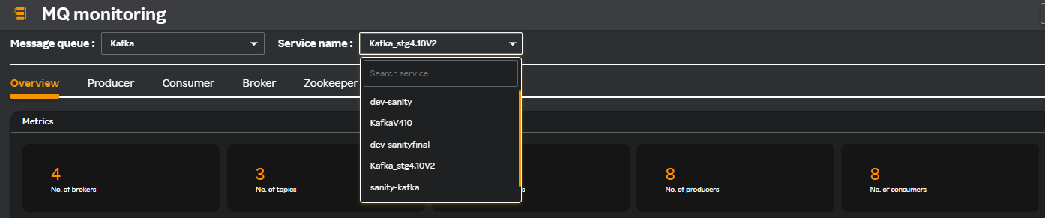
A screen similar to the following is displayed.
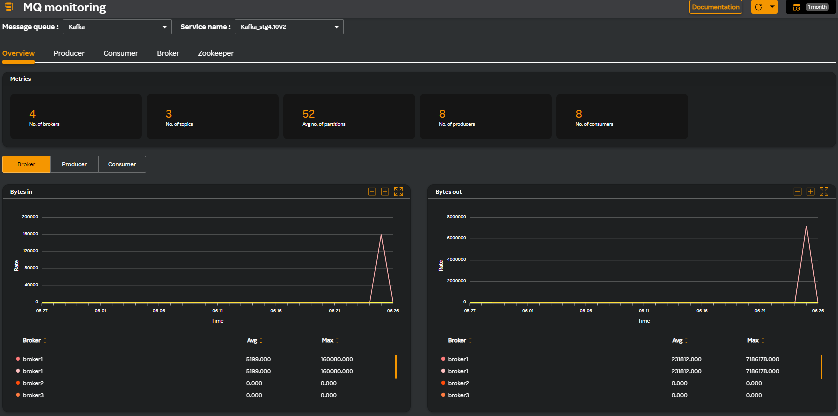
The top pane displays the following metrics and you can view total number of the various Kafka concepts at a glance.
| Metric name | Description |
|---|---|
| No. of brokers | Number of brokers within a Kafka cluster. |
| No. of topics | The count of topics i.e published messages sent to all subscribers. |
| No. of partitions | Number of partitions i.e. basic units of data organization within a topic. |
| No. of producers | The number of producers sending messages. |
| No. of consumers | The number of consumers connected to Kafka. |
Overview
The Overview concept is selected by default and contains the following tabs.
Broker
This tab contains the following widgets which lets you comprehend the metrics in a graph format.
| Widget name | Description |
|---|---|
| Bytes in | Amount of data that is received by the broker from clients or other brokers. |
| Bytes out | Amount of data that is sent out by the broker to clients or other brokers. |
| Total produced request rate | Rate at which producer clients are sending messages to the broker. |
| Total fetch request rate | Rate at which consumer clients are requesting messages from the broker. |
| Message in | Rate at which messages are being produced to the broker. |
| Leader election rate | Frequency at which leadership of partitions changes within the broker cluster. |
| Uncleaned election leader per second | Rate at which unclean leader elections are occurring. |
| No. of brokers | Number of brokers that store and manage the data within a Kafka cluster. |
Producer
This tab contains the following widgets which lets you comprehend the mterics in a graph format.
| Widget name | Description |
|---|---|
| Request rate | Frequency at which the producer client is sending requests to the Kafka broker. |
| Response rate | Frequency at which the producer client receives responses from the Kafka broker. |
| Error rate | Frequency at which the producer encounters errors while sending messages to the Kafka broker. |
| Request avg latency | Average time taken for the producer to send a request to the Kafka broker and receive a response. |
| No. of producers | The number of producers sending messages. |
Consumer
This tab contains the following widgets which lets you comprehend the metrics in a graph format.
| Widget name | Description |
|---|---|
| Average fetch size | Average amount of data fetched by the consumer in each fetch request. |
| Response rate | Frequency at which the producer receives responses from the Kafka broker after sending messages. |
| Consumer lag | The difference between the latest message produced by a producer and the latest message consumed by a consumer. |
| Message consumed | Messages that have been successfully processed and consumed by the consumer from Kafka topics. |
| No. of consumers | Count of active consumer instances that are part of a consumer group and are actively consuming messages from Kafka topics. |