Adding alerts
You can add alerts for APM, BM, VM, Mobile, and Kubernetes monitoring capabilities that have forecasting enabled for Premium customers using the following procedure.
- Navigate to Alerts on the left pane from the SixthSense portal.
- Select any capability that is available for Premium customers in the capability drop-down list
- Select an application from the application drop-down list next to it.
- Click Add alert.
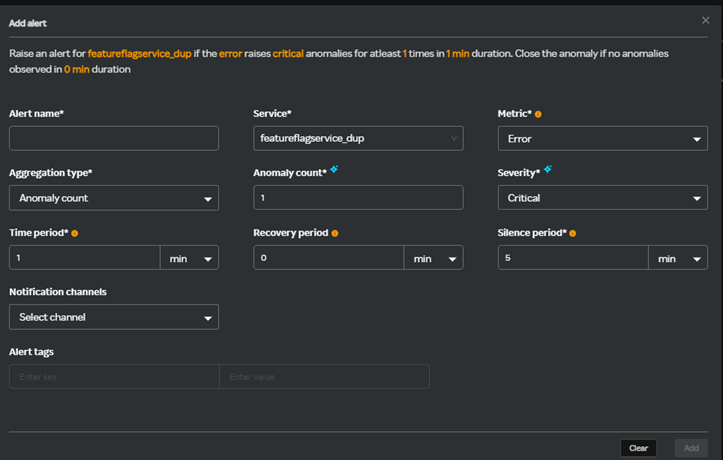
A screen similar to the following appears.

The following fields are available only for Premium customers as compared to the SixthSense AO customers. For the rest of the fields that are similar to AO, you can refer to Configure Alerts.
| Field | Description |
|---|---|
| Metric | Metrics available here have forecasting enabled. For more information, see Metrics |
| Aggregation type | Anomaly count is an aggregation type (method or approach used to combine, process, or summarize data based on the metric selected earlier) available for Premium customers. |
| Anomaly count | The number of anomalies. |
| Severity | This field contains the severity of the anomalies such as Critical, Major, and Critical & Major. |
For example, when you select Aggregation type as Anomaly count, Anomaly count as 5 with Severity Critical, and Time period as 5 minutes, you will receive alerts if there are more than 5 critical anomalies that occurred within 5 minutes.
Metrics for forecasting
| Capability | Metric name |
|---|---|
| Application Performance Monitoring | Error, Load, Response time, Instance response time, Instance error, Instance load, Endpoint response time, Endpoint error, and Endpoint load |
| Browser Monitoring | Error, Load, Page load time, Response time. |
| Mobile monitoring | Total crashes, Number of Requests, HTTP Response Time, |
| Virtual monitoring | Instance CPU Usage (%), Instance Memory Available (%), Instance File System available (%), Instance network total (Bytes per/sec) |
| Kubernetes monitoring | Cluster CPU usage %, Cluster memory usage %, Total FS Usage % |