.Net metrics
The Code Profiler for .Net framework/core provides detailed insights into the performance of .net applications by capturing method-level execution and resource consumption metrics.
Benefits of these metrics are as follows:
- Analyse the performance of functions or codes within the function.
- Analyse code execution paths, identify inefficient algorithms or methods, and optimize code for better performance and scalability.
- Detect and diagnose issues such as CPU spikes, excessive memory consumption, or thread contention, enabling faster troubleshooting and resolution of problems.
- Analyse the health of .net application code i.e. Method-Level Profiling, Transaction Tracing, Memory Profiling, and CLR metrics.
To view the various available metrics perform the following procedure.
- Navigate to APM > Dashboard > Instance.
- Click on an instance name under the Name column.
The following performance counter tabs are available only for .Net metrics. Clicking these tabs display the relevant metric widgets.
note
.Net framework supports performance counters where as .Net Core does not.
Memory
The .NET CLR Memory category includes counters that provide information about the garbage collector. The following widgets describe these performance counters.
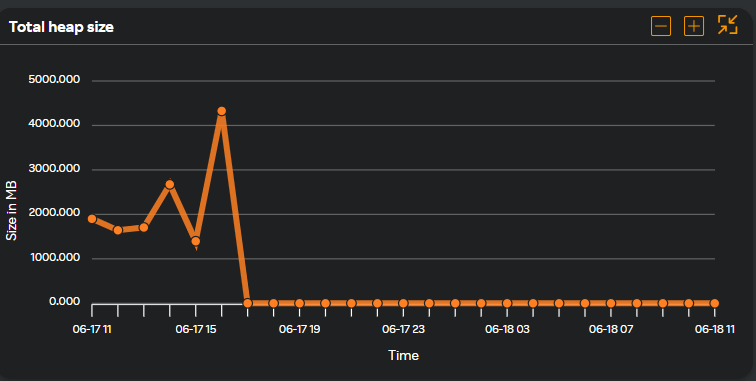
Total heap size
This widget displays the total amount of memory allocated for the managed heap by the Common Language Runtime (CLR).
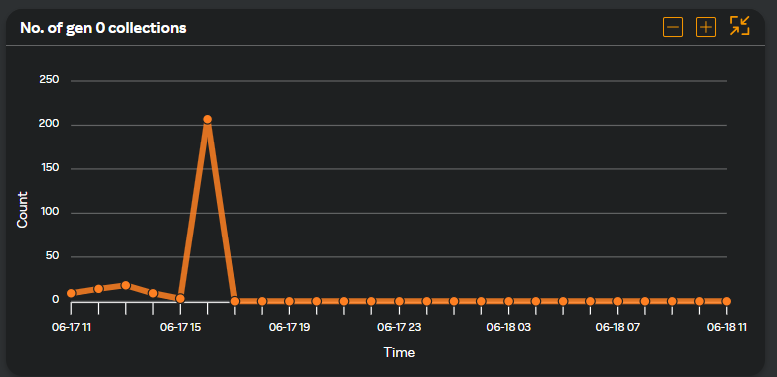
No. of gen 0 collections
This widget displays the number of times the generation 0 objects (that is, the youngest, most recently allocated objects) are garbage collected since the application started.
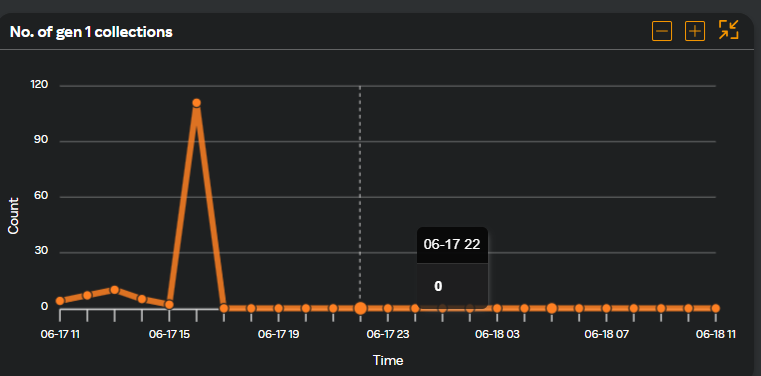
No. of gen 1 collections
This widget displays the number of times the generation 1 objects are garbage collected since the application started.
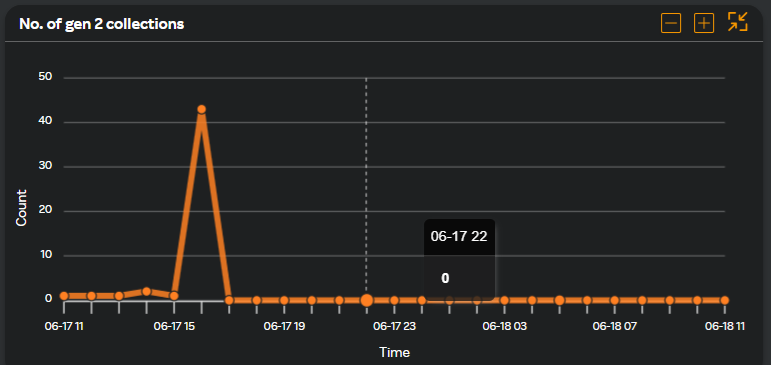
No. of gen 2 collections
This widget displays the number of times the generation 2 objects are garbage collected since the application started. The counter is incremented at the end of a generation 2 garbage collection (also called a full garbage collection).
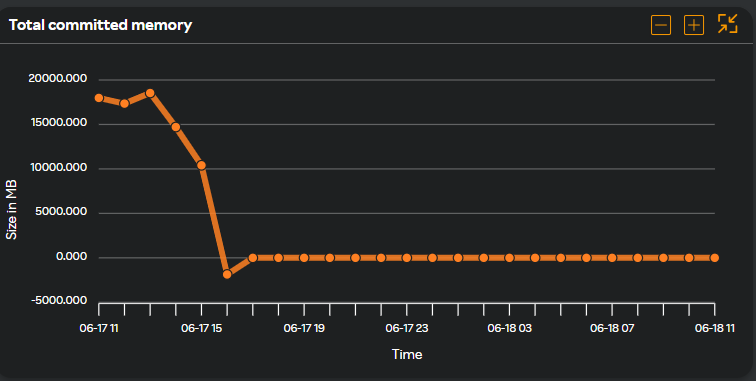
Total committed memory
This widget displays the amount of virtual memory, currently committed by the garbage collector. Committed memory is the physical memory for which space has been reserved in the disk paging file.
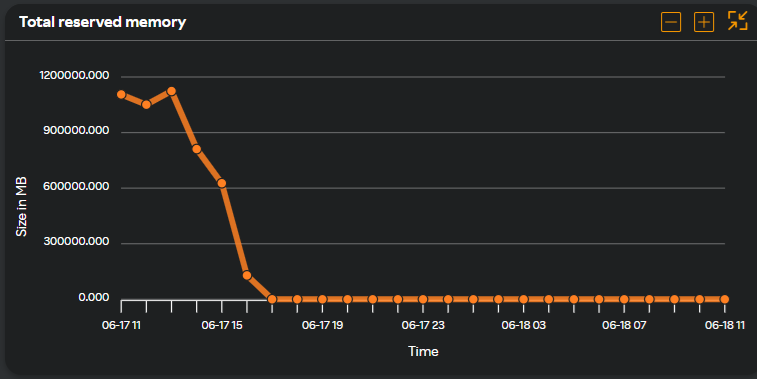
Total reserved memory
This widget displays the amount of virtual memory, currently reserved by the garbage collector. Reserved memory is the virtual memory space reserved for the application when no disk or main memory pages have been used.
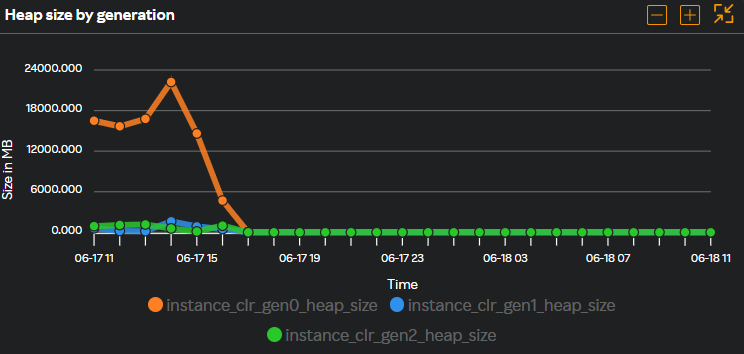
Heap size by generation
Monitoring the heap size by generation in a .NET application provides valuable insights into memory usage and the efficiency of the garbage collection process. This widget displays the heap size used in MB for a selected time period.
Lock & Threads
The .NET CLR LocksAndThreads category includes counters that provide information about managed locks and threads that an application uses. The following widgets describes these performance counters.
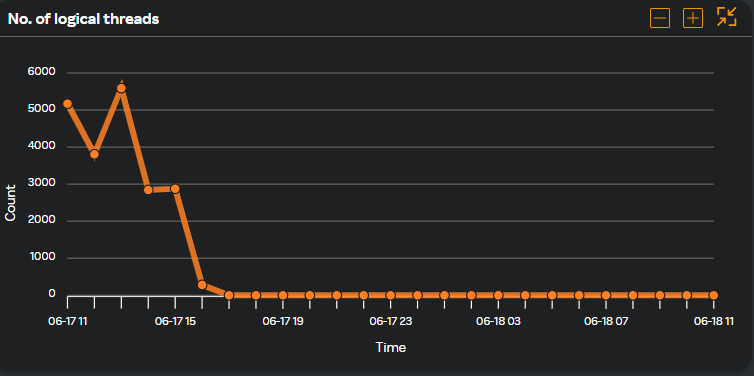
No. of logical threads
This widget displays the number of currently managed thread objects in the application.
No. of physical threads
This widget displays the number of native operating system threads created and owned by the common language runtime to act as underlying threads for managed thread objects.

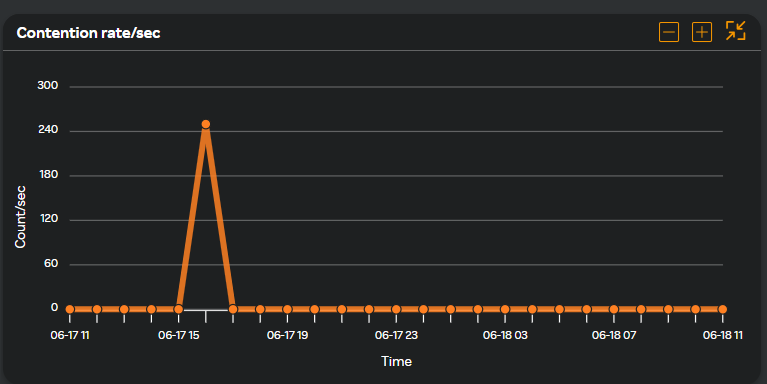
Contention rate/second
This widget displays the rate at which threads in the runtime attempt to acquire a managed lock unsuccessfully.
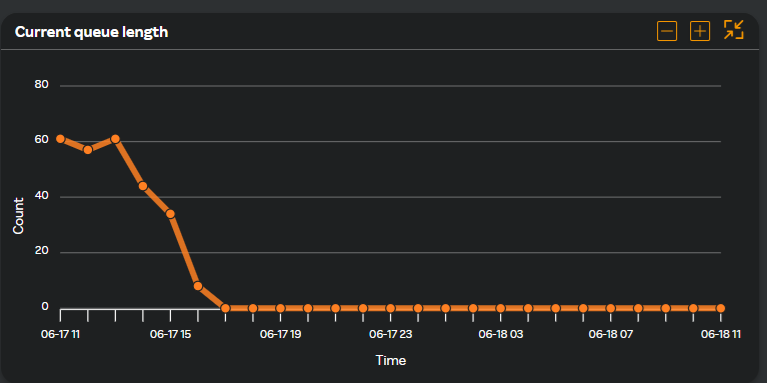
Current queue length
This widget displays the total number of threads that are currently waiting to acquire a managed lock in the application. This counter is not an average over time; it displays the last observed value.
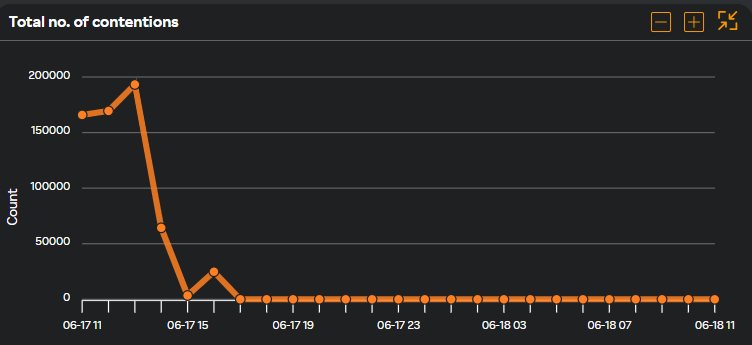
Total no. of contentions
This widget displays the total number of times that threads in the runtime have attempted to acquire a managed lock unsuccessfully.
Loading
The .NET CLR Loading category includes counters that provide information about assemblies, classes, and application domains that are loaded. The following widgets describe these performance counters.
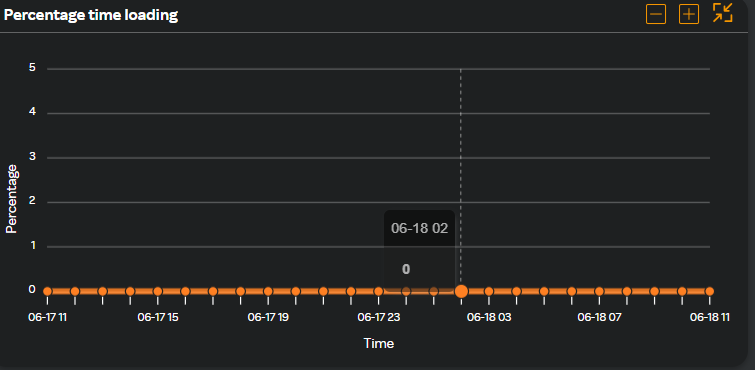
Percentage time loading
This widget indicates the proportion of time an application spends in a loading or waiting state compared to its total execution time.
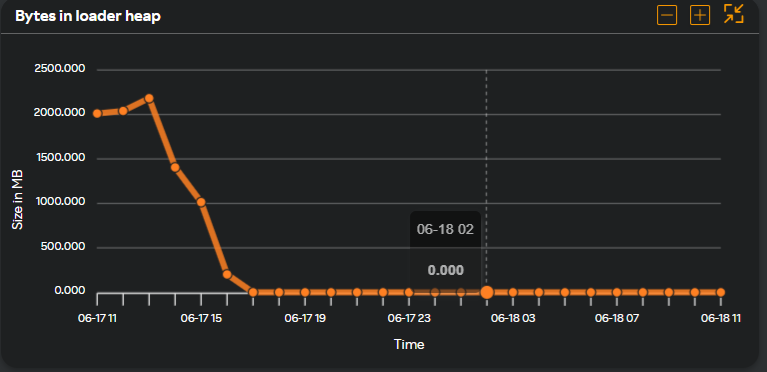
Bytes in loader heap
This widget displays the current size, in bytes, of the memory committed by the class loader across all application domains. Committed memory is the physical space reserved in the disk paging file.
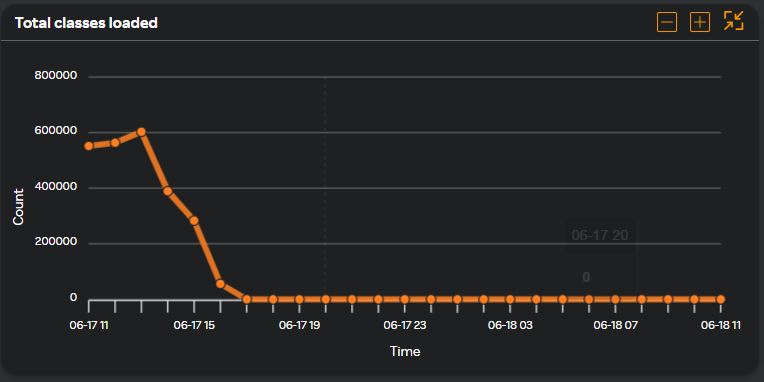
Total classes loaded
This widget displays the number of classes loaded in all assemblies.
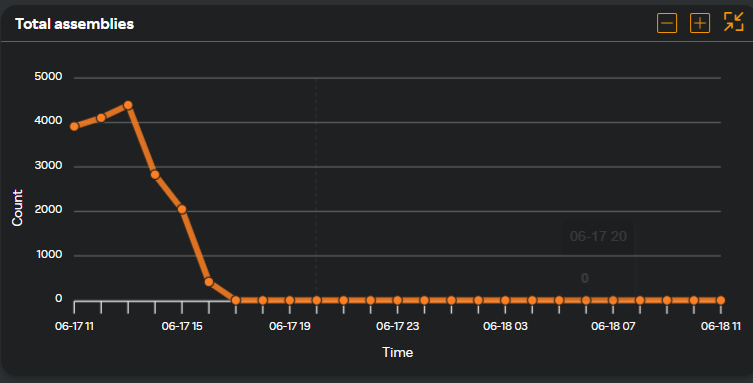
Total assemblies
This widget displays the total number of assemblies loaded across all application domains.
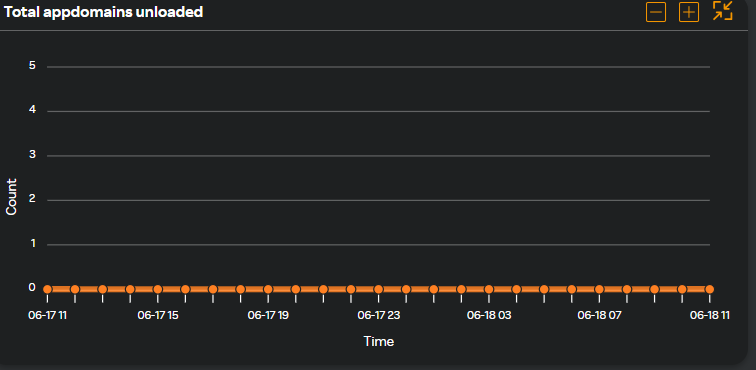
Total appdomains unloaded
This widget displays the total number of application domains unloaded.
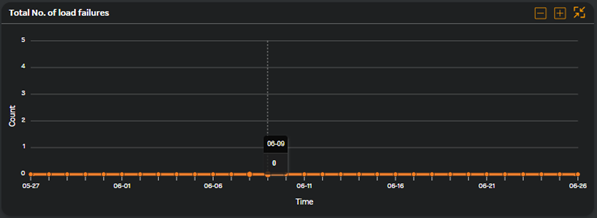
Total No. of load failures
This widget displays the number of classes that failed to load.
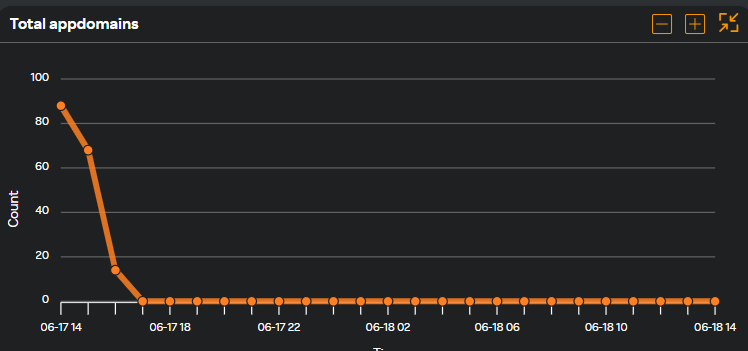
Total appdomains
This widget displays the peak number of application domains loaded since the application started.
Exceptions
The .NET CLR Exceptions category includes counters that provide information about the exceptions thrown by an application. The following widgets describe these performance counters.
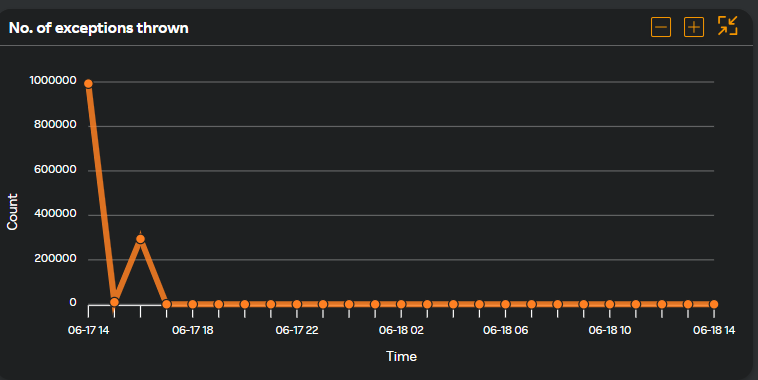
No. of exceptions thrown
This widget displays the total number of exceptions thrown since the application started. This includes both .NET exceptions and unmanaged exceptions that are converted into .NET exceptions.
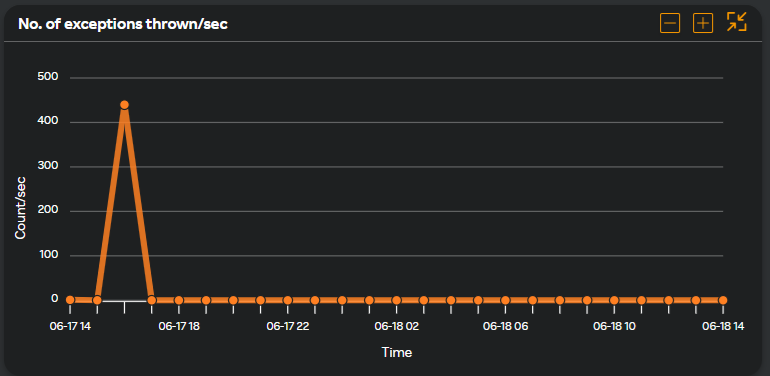
No. of exceptions thrown/sec
This widget displays the number of exceptions thrown per second. This includes both .NET exceptions and unmanaged exceptions that are converted into .NET exceptions.
No. of filters/sec
This widget displays the number of .NET exception filters executed per second. An exception filter evaluates regardless of whether an exception is handled.
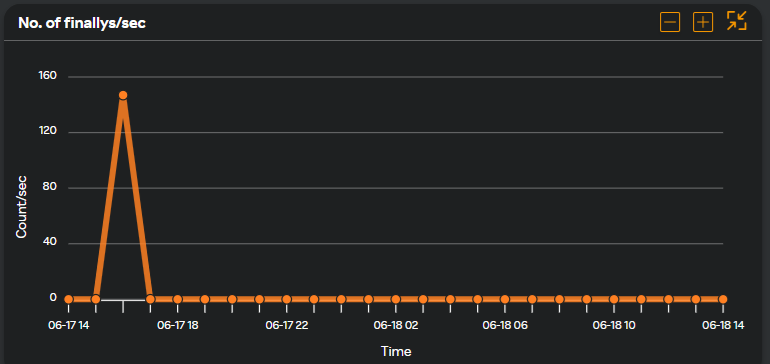
No. of finallys/sec
This widget displays the number of finally blocks executed per second. A finally block is guaranteed to be executed regardless of how the try block exited.
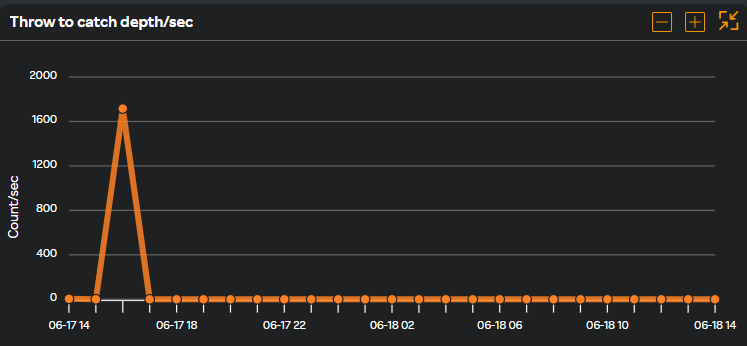
Throw to catch depth/sec
This widget displays the number of stack frames traversed, from the frame that threw the exception to the frame that handled the exception, per second.
Interops
The .NET CLR Interop category includes counters that provide information about an application's interaction with COM components, COM+ services, and external type libraries. The following widgets describe these performance counters.
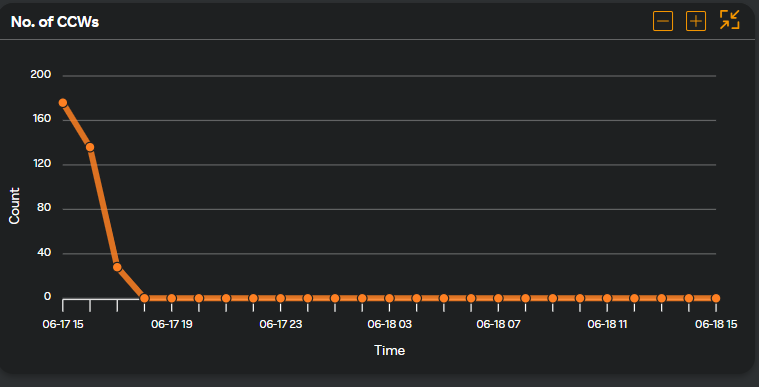
No. of CCWs
This widget displays the current number of COM callable wrappers (CCWs). A CCW is a proxy for a managed object being referenced from an unmanaged COM client.
No. of marshalling
This widget displays the total number of times arguments and return values have been marshalled from managed to unmanaged code, and vice versa, since the application started.
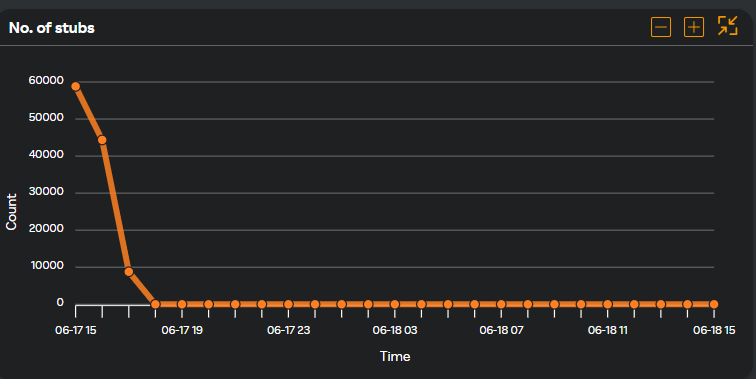
No. of stubs
This widget displays the current number of stubs created by the common language runtime. Stubs are responsible for marshalling arguments and return values from managed to unmanaged code, and vice versa, during a COM interop call or a platform invoke call.
No. of TLB exports/sec
This metric measures the rate at which transactions are being exported from the transaction log of the publication database to the distribution database. This widget displays the number of TLD exports per second for the selected time period.
No. of TLB imports/sec
This metric is associated with database replication, specifically in the context of SQL Server transactional replication. This widget displays the rate at which transactions are imported from the distribution database to the subscriber database per second.
JIT
The Just-In-Time (JIT) compilation process converts the Intermediate Language (IL) code into native machine code at runtime. This helps execute the .Net applications and is monitored to ensure optimal performance.
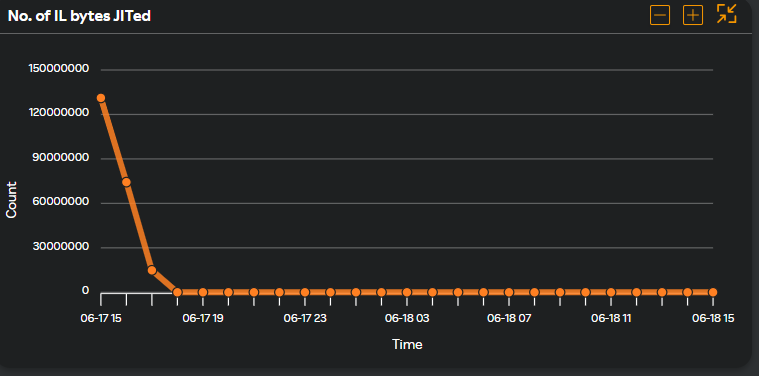
No. of IL bytes JITed
The .NET CLR JIT category includes counters that provide information about code that has been JIT-compiled. The following widgets describe these performance counters.
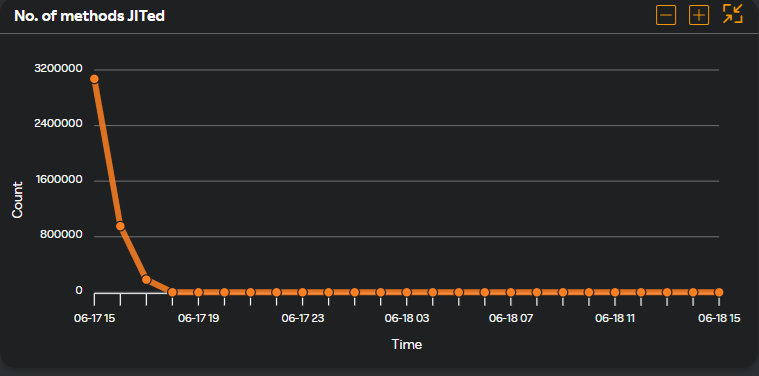
No.of methods JITed
This widget displays the total number of methods JIT-compiled since the application started.
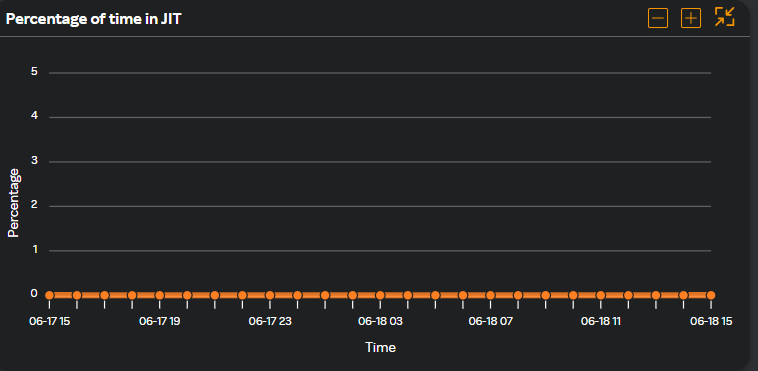
Percentage of time in JIT
This widget displays the percentage of elapsed time spent in JIT compilation since the last JIT compilation phase.
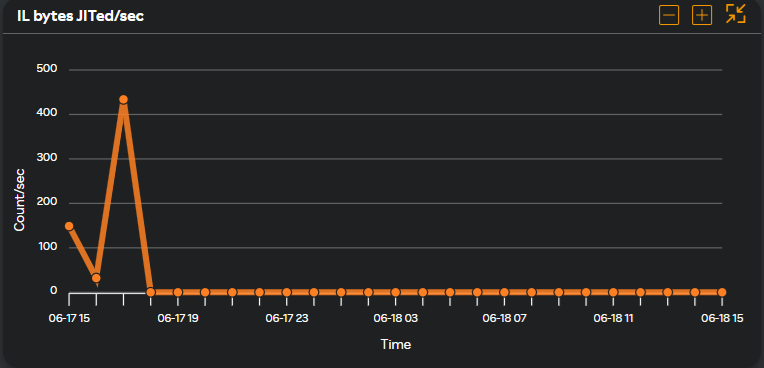
IL bytes JITed/sec
This widget displays the number of CIL bytes that are JIT-compiled per second.
Networking
The .NET CLR Networking category includes counters that provide information about data that an application sends and receives over the network. The following widgets describe these performance counters.
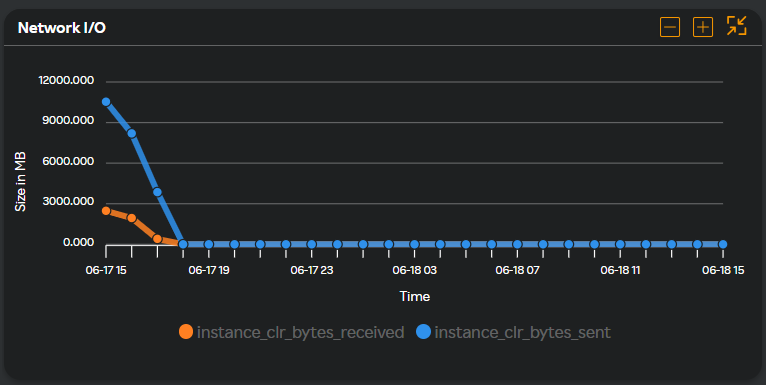
Network I/O
This widget displays the cumulative total number of bytes received by all Socket objects within the AppDomain since the process started.
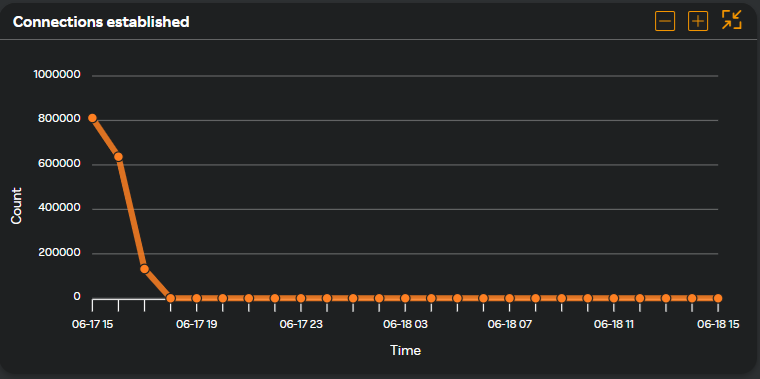
Connections established
The cumulative total number of Socket objects for stream sockets that were ever connected within the AppDomain since the process started. This widget displays the
Datagrams received
This widget displays the cumulative total number of datagram packets received by all Socket objects within the AppDomain since the process started.

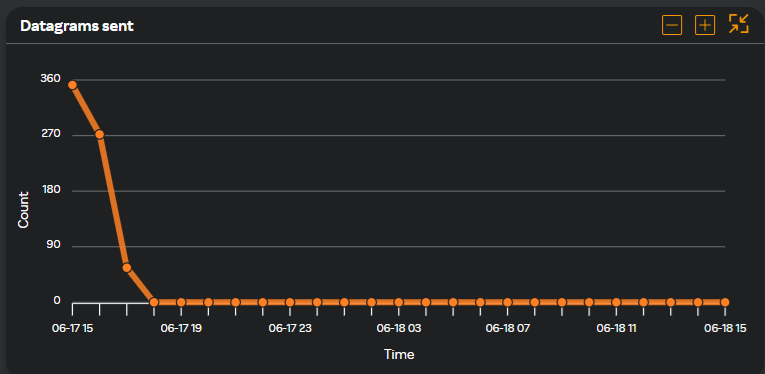
Datagrams sent
Displays the cumulative total number of datagram packets sent by all Socket objects within the AppDomain since the process started.
Security
The .NET CLR Security category includes counters that provide information about the security checks that the common language runtime performs for an application. The following widgets describe these performance counters.
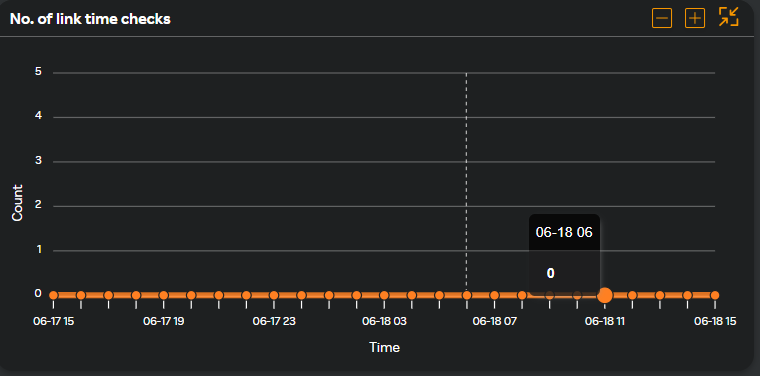
No. of link time checks
This widget displays the total number of link-time code access security checks since the application started.
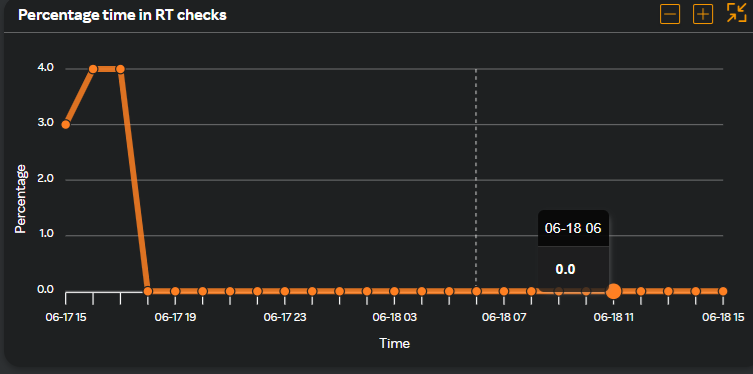
Percentage time in RT checks
This widget displays the percentage of elapsed time spent performing runtime code access security checks since the last sample.
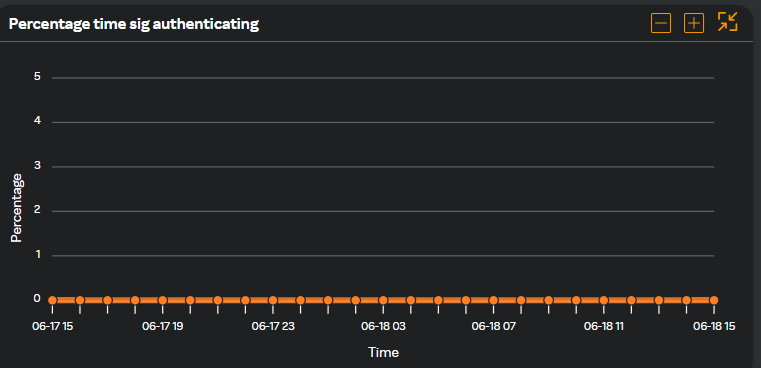
Percentage time sig authenticating
This metric is the time spent on cryptographic operations, such as verifying digital signatures within the application. The widget displays the percentage time of signature authentications against the selected time period.
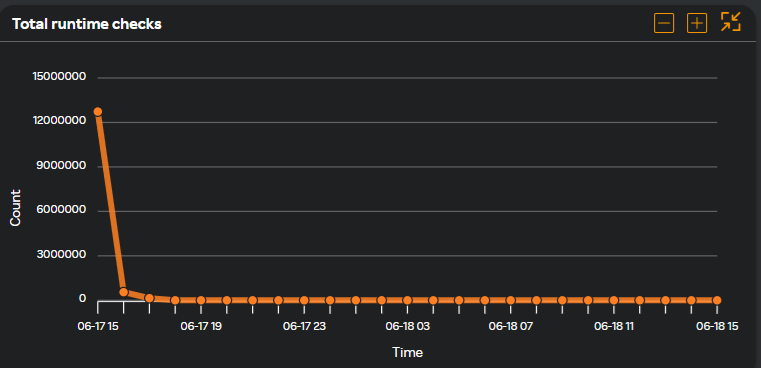
Total runtime checks
This widget displays the total number of runtime code access security checks performed since the application started.
Related topic:
Refer to https://learn.microsoft.com/en-us/dotnet/framework/debug-trace-profile/performance-counters for more information on the performance counters in the .Net framework.