Setting up notification channels
Notification channels dashboard
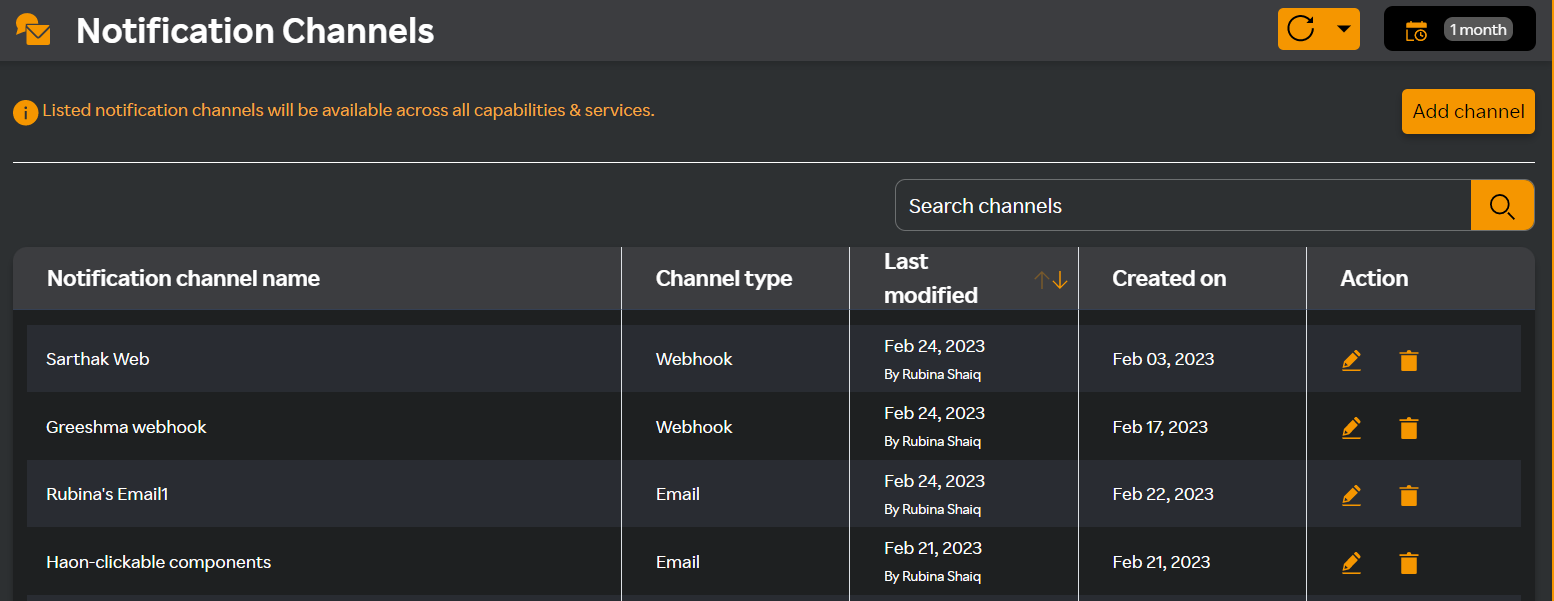
The Notification Channels dashboard displays the following details.
note
You can manage channels you have created from the Notification Channels dashboard.
- Click the
 icon to search for channels created for a particular channel type.
 - Click the
 icon to edit a channel under the Action column.
 - Click the
 icon to delete a channel under the Action column.
The SixthSense platform supports the following notification channels:
- Email Notification
- Slack Integration
- Webhook Integration
Adding an email notification channel
- Login to the SixthSense Observability portal.
- Click Notification channels on the left pane.
- Click Add channel.
- In the Add channel window, fill in the following fields.
| Field | Description |
|---|---|
| Channel name | Enter a name for the channel. |
| Channel type | Select Email from the drop-down list. |
Enter an email address in the Enter email address field.
Click + icon to add multiple email addresses.
Click Save.
Alerts will be triggered to all the specified email channels.
You can configure an SMTP server for receiving notifications. For more information, see Configuring SMTP server.
Example: Email notification template with SixthSense email selected
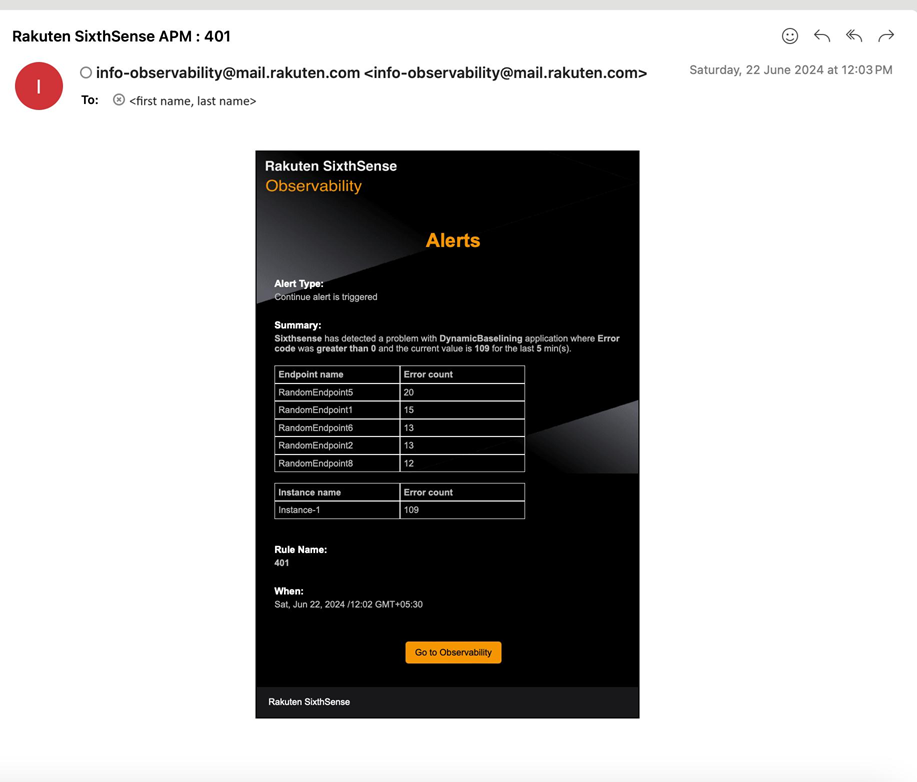
The email template contains the following details:
- The email subject is displayed in the following format: Rakuten SixthSense $Capability : $alert_rule_name. For example in the template, the subject line at the very top says "Rakuten SixthSense APM: 401" where APM is the capability and 401 is the rule name.
- Alert type denotes if an alert is new or is a continue alert which means notification for alerts is sent after the silence period value is met.
- Summary displays that a problem was detected with a dynamic baselining application (Application/Server/DB name) and details of the metrics name that was breached, the threshold value (how long the threshold was breached), the current value, and the time period during which alerts were triggered. Sample format of the summary is as follows: SixthSense has detected a problem with $Service_Name where the $Metrics_Name has breached the $Threshold_Value where the current value is $Current_Value for the last $Time.
- Rule Name is the alert rule name you have created.
- When displays the date and time when the alert triggerd. The email alerts are in sync with the timezone you have selected from the Settings page. For setting your timezone, see Setting up your timezone.
- Click the Go to Observability tab in the email you received which will take you to the metric relevant tabs in Database monitoring (Cluster, Node, or Bucket pages) and Mobile monitoring (Crashes or Performance pages) dashboards.
Example: Email notification template with SMTP server configured
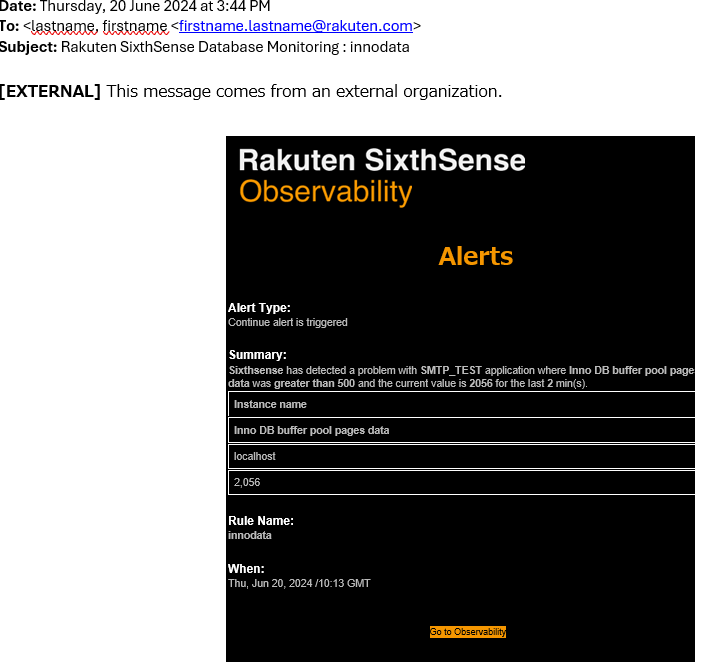
The email template details are similar to the previous example.
Adding a slack notification channel
- Login to the SixthSense Observability portal.
- Click Notification channels on the left pane.
- Click Add channel.
- In the Add channel window, fill in the following fields.
| Field | Description |
|---|---|
| Channel name | Enter a name for the channel. |
| Channel type | Select Slack from the drop-down list. |
Enter a slack URL in the Enter slack URL field.
Click + icon to add multiple URLs.
Click Save.
Alerts will be triggered to all the specified slack channels.
Example: Slack notification template
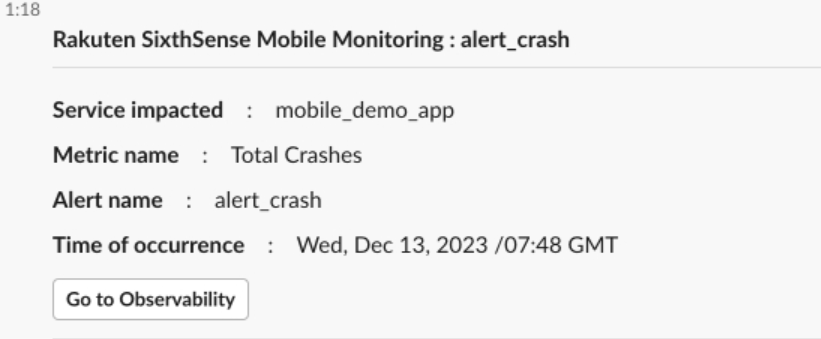
The slack channel notification displays the following details:
- Subject title displays the capability name followed by the alert name you have created.
- Name of the service that was impacted.
- Name of the metric that was affected.
- Name of the alert that you have created.
- Time when the alert was triggered.
Adding a webhook notification channel
- Login to the SixthSense Observability portal.
- Click Notification channels on the left pane.
- Click Add channel.
- In the Add channel window, fill in the following fields.
| Field | Description |
|---|---|
| Channel name | Enter a name for the channel. |
| Channel type | Select Webhook from the drop-down list. |
note
The Data text editor contains the default webhook template.
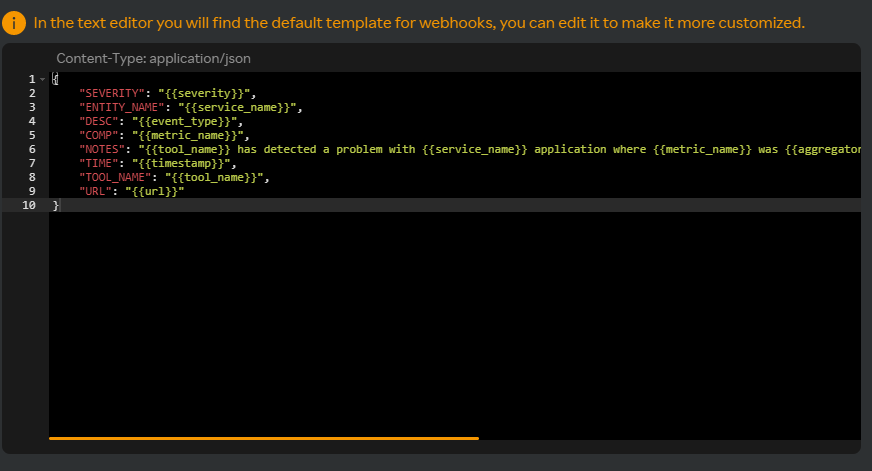
- Edit the template and customize using the Supported webhook variables displayed in the right pane. The following table contains the variables and their description.
| Variable | Description |
|---|---|
| {{alert_name}} | Specifies the name of the alert. |
| {{capability}} | Specifies the capability of the alert. |
| {{service_name}} | This will specify the application, server hostname, and database name for which an alert is triggered. |
| {{event_type}} | This is specific to an alert that is a new event or continuing event. The alert email received contains a hyperlink to go to the Observability dashboard. |
| {{severity}} | Specifies the severity of the alert. |
| {{timestamp}} | Time at which an alert is triggered |
| {{tool_name}} | The tool which triggered an alert. Default is 'SixthSense'. |
| {{metric_name}} | Metrics on which an alert is triggered. |
| {{aggregator_operator}} | Operators such as Greater than, Less than, and so on. |
| {{current_value}} | The metric value when an alert is triggered. |
| {{threshold_value}} | The threshold value set in an alert. |
| {{period}} | The time period from when an alert triggered until the specified time. |
| {{url}} | This will be replaced with the link to SixthSense dashboard when the event occurred. |
- Select the Tagging toggle button if you have any alerts tagged.
The following Data text editor screen is displayed.
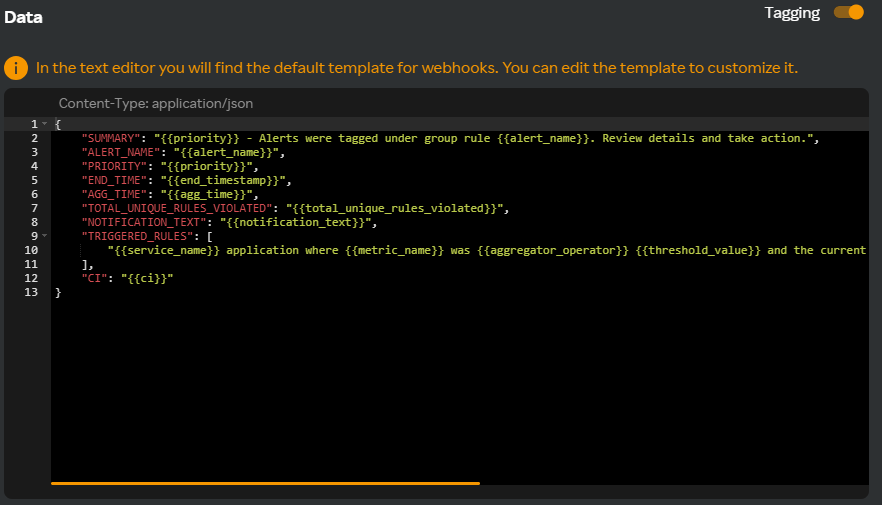
The Supported webhook variables displayed in the right pane varies as in the following table.
| Variable | Description |
|---|---|
| {{priority}} | Specifies the priority of the alert. |
| {{alert_name}} | Specifies the name of the alert. |
| {{end_timestamp}} | The timestamp indicating when the execution of the alert rule was finished. |
| {{agg_time}} | The duration starting from the moment the first alert was triggered until the specified time. |
| {{total_unique_rules}} | the total count of distinct alert rules that were violated based on the configured tags. |
| {{notification_text}} | Specifies the custom notification text. |
| {{service_name}} | This will specify the application, server hostname, and database name for which an alert is triggered. |
| {{metric_name}} | Metrics on which an alert is triggered. |
| {{aggregator_operator}} | Operators such as Greater than, Less than, and so on. |
| {{threshold_value}} | The threshold value set in an alert. |
| {{total_occurrences}} | The overall number of occurrences during the active evaluation of alert grouping. |
| {{ci}} | CI refers to configuration item. |
note
The notification text variable allows you to add a customized webhook notification text.
- Enter a webhook URL in the Enter webhook URL field.
- Click + icon to add multiple URLs.
Webhook Authentication
- In the Authentication field, select “No” when webhook authentication is not required.
- If webhook requires a secured authentication then select "Yes" under Authentication field.
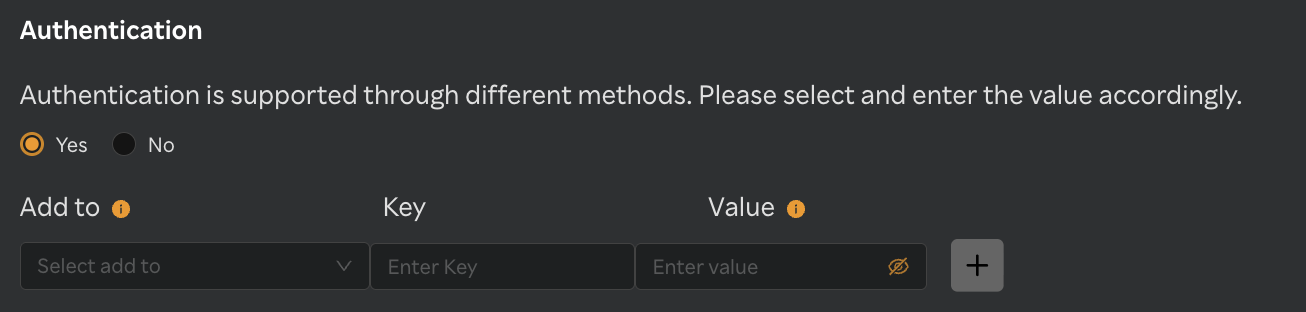
Sixthsense webhook authentication is supported through below methods:
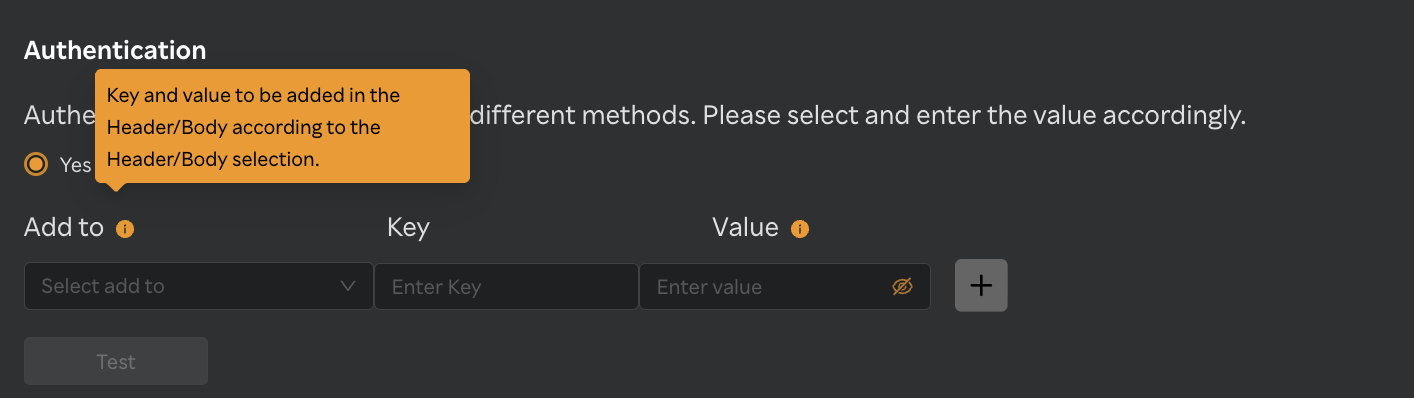
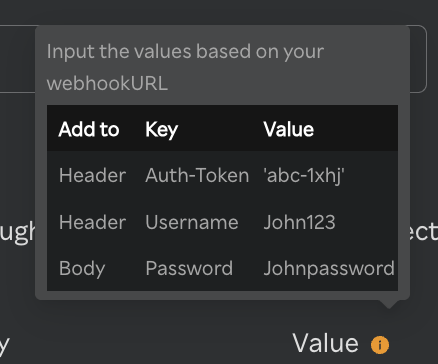
Add to -- This field contains two options, Header & Body
- If Header is selected the Key & Value are added to Header of Webhook URL
- If Body is selected the Key & Value are added to Body of Webhook URL
Key & Value -- Key & value pair can be entered here used to webhook authentication based on the webhook URL configured Sample configuration of Authentication parameters: |Add to|Key|Value| |------------|---------------|-----| |Header|username|rakutensixthsense| |Header|password|sixthsense1234| |Body|username|rakutensixthsense| |Body|password|sixthsense1234| |Header|Bearer-Token|abcdef123=| |Header|Auth-token|qwerttyui#| |Body|routing_key|123445ghkl| |Body|key1|"value1"|
note
Ensure the entered value matches the expected format of the webhook URL configured in Step 7.
Click + icon to add multiple key & value pairs. User can add atmost 5 key & value pairs per one notification channel. Same key-value pairs will be used for all webhook URL's added in the step 7.
Click Test button to validate if webhook authentication is successful with provided authentication paramters or not. Once test button is clicked it validates webhook URL & template with authentication Key & value and returns the status codes respectively.
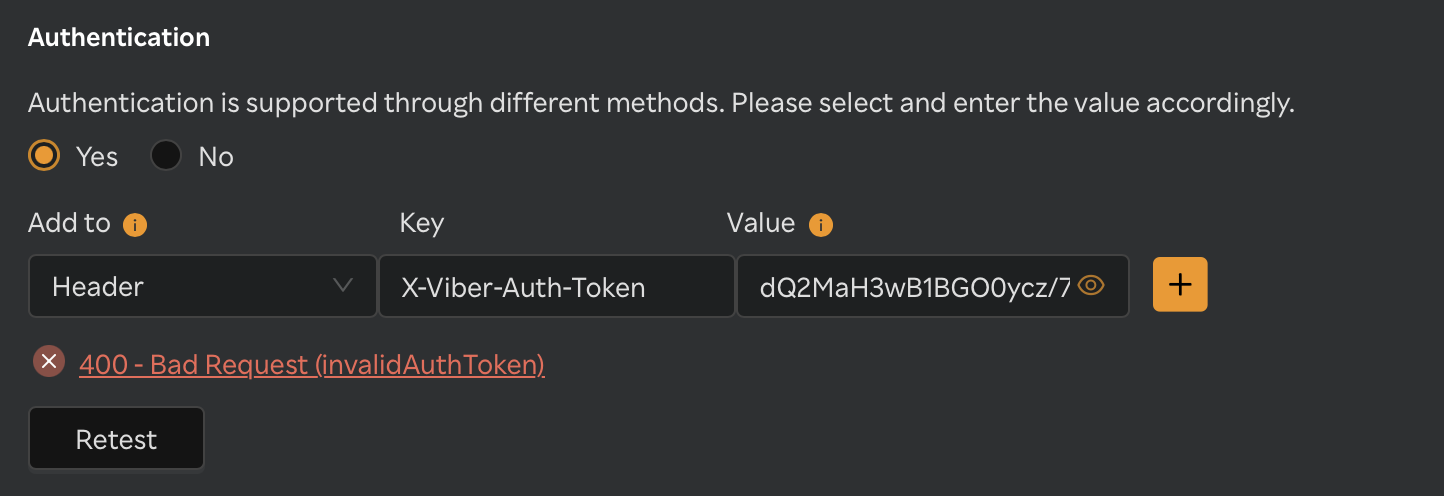
If webhook URL doesn't return 2xx status code, click on Retest button.
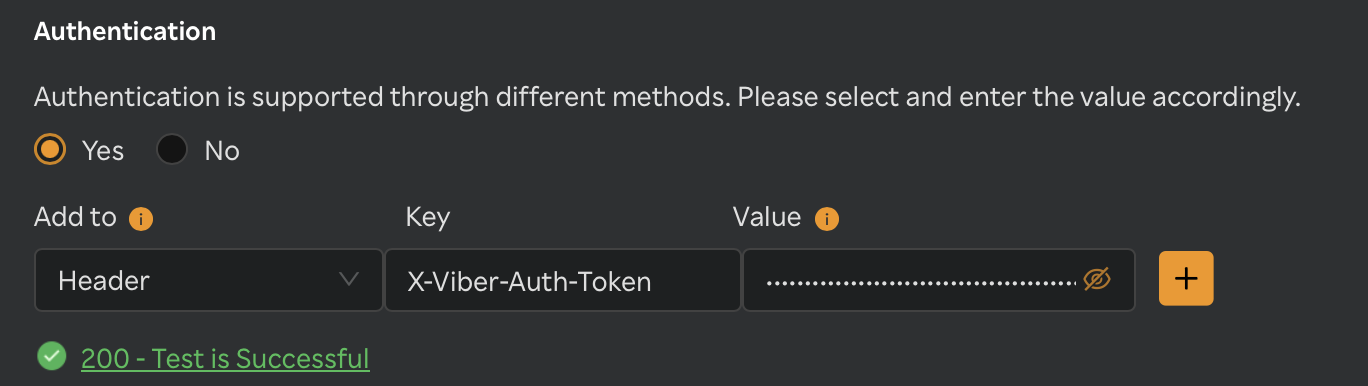
Once webhook authentication validation is successful, webhook URL return 2xx status code and Save button is enabled for saving the notification channel.
Click Save.
Alerts will be triggered to all the specified webhook channels.