Adding a widget
- Click the
 icon in the saved search row.
 - Select Add widget.
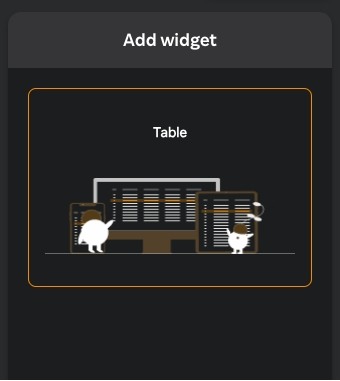
If the query type is table, you will get a table widget option in the right pane as in the following screen.
If the query type is metric, you will get a graph or label widget option in the right pane as in the following screen.
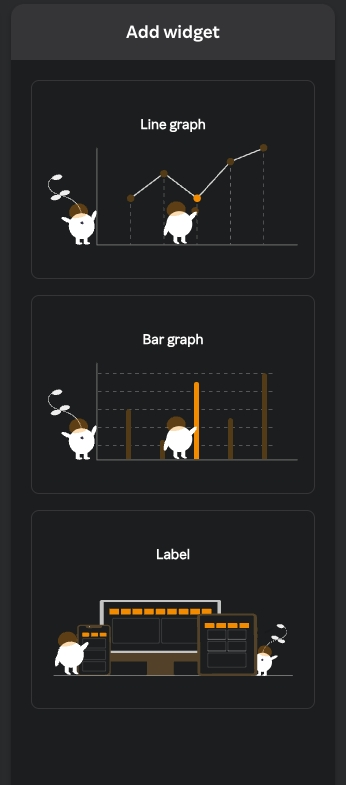
- Click the widget type you want to add in the right pane.
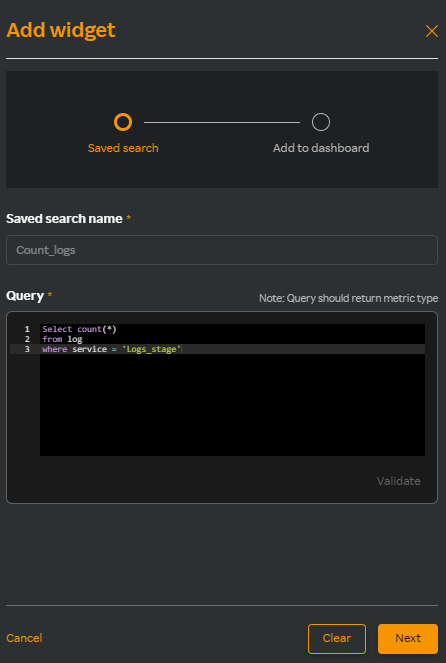
- In the Add widget window the following details appear.
| Field | Description |
|---|---|
| Saved search name | The search name you have selected appears by default. |
| Query | The query saved against the saved search name appears by default. |
- Click Next. The following screen appears.
Do any of the following.
a. Click Existing dashboard to select from an existing dashboard.
b. Click New dashboard to create a new dashboard.
Enter the following details if you have selected Existing dashboard in step a.
| Field | Description |
|---|---|
| Widget name | Name for the widget |
| Select dashboard | Select an existing dashboard |
- Enter the following details if you have selected New dashboard in step b.
| Field | Description |
|---|---|
| Widget name | Name for the widget |
| Dashboard name | Select the new dashboard name. |
| Copy template | Select a template from an existing dashboard. |
- Click Create.
The new dashboard you have created appears under the Select dashboard drop-down list in the Rakuten SixthSense Observability home page. For more information about the Log Monitoring dashboard, see Log monitoring dashboard.