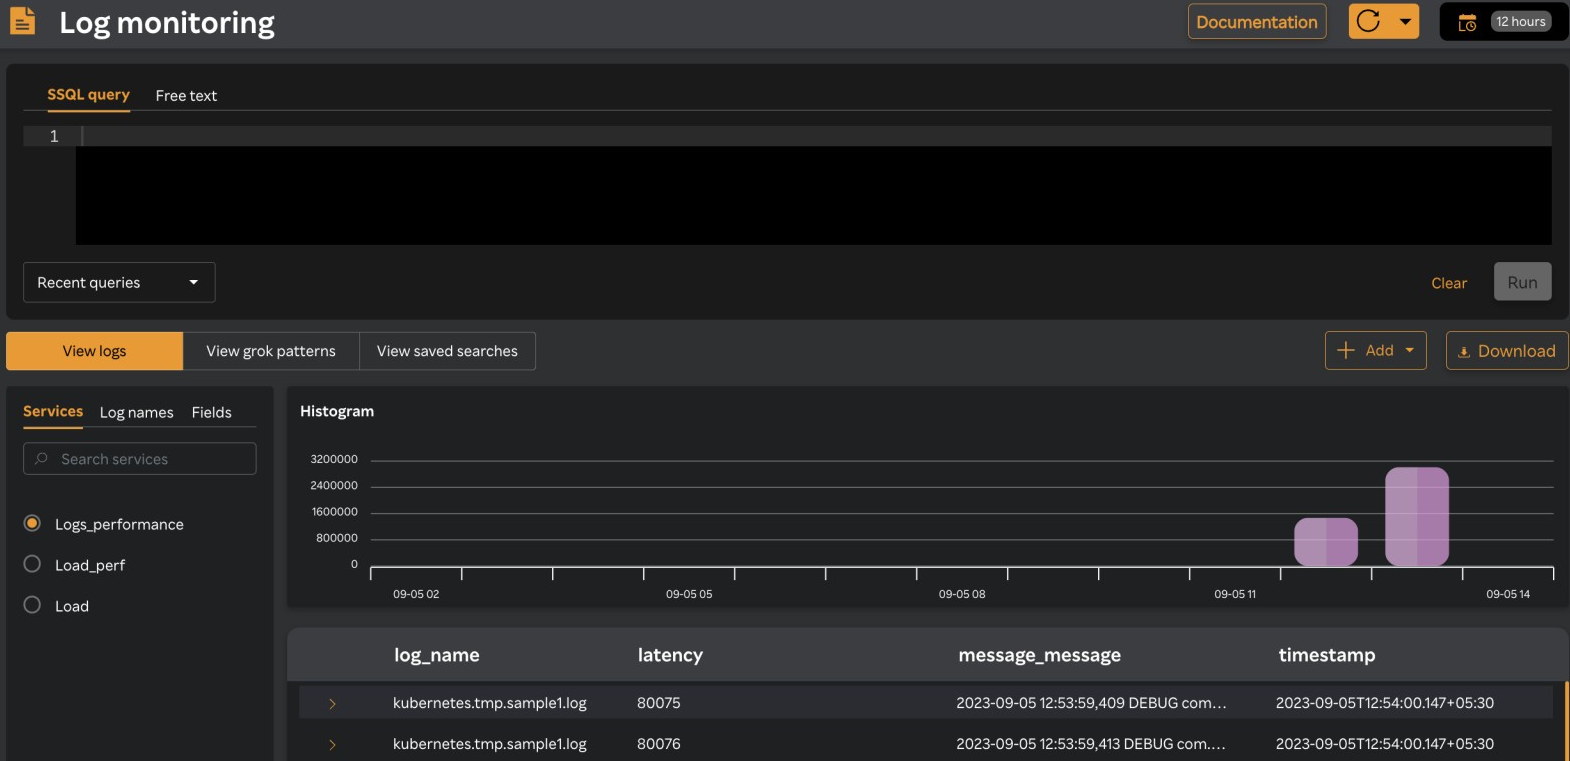
Log Monitoring Dashboard
Use the log monitoring dashboard to view the following:
- View, write and run queries
- View and download logs
- View or add grok patterns
- View saved searches
- View log graphs that occured for a selected period
- View the list of services, log names, and fields specified by the user.
Query pane
SixthSense Observability supports the SQL query language. The query pane allows you to add your query on logs and run them. Details based on the query are displayed in the viewing logs/grok patterns pane. For more information, see Creating and running queries
Services/Log names/Fields pane
Services: Lists the service names. This is specified by the user while onboarding.
Log names: Lists the log names given to a set of logs. For example, a set of logs that are generated from various databases can be named as mongodb, elasticsearch etc. These are specified by the user while onboarding.
Fields: Lists the field names. These are displayed as columns in the Viewing logs/grok patterns/saved searches pane. By default, the following 4 fields are displayed.
- log_name
- latency
- message_message
- timestamp
Histogram
This is a graphical representation of the number of logs that are generated for a source during a selected period.
Viewing logs/grok patterns/saved searches pane
You can either view logs, grok patterns, or saved searches in this pane based on the View logs/View grok patterns/View saved searches tabs you have selected.
If you run a query, the query details are also displayed in this pane and the View logs/View grok patterns/View saved searches tabs are disabled.