Viewing saved searches
- Navigate to Log monitoring on the left pane.
- Click View saved searches tab.
The following screen appears with the list of saved searches you have already created.
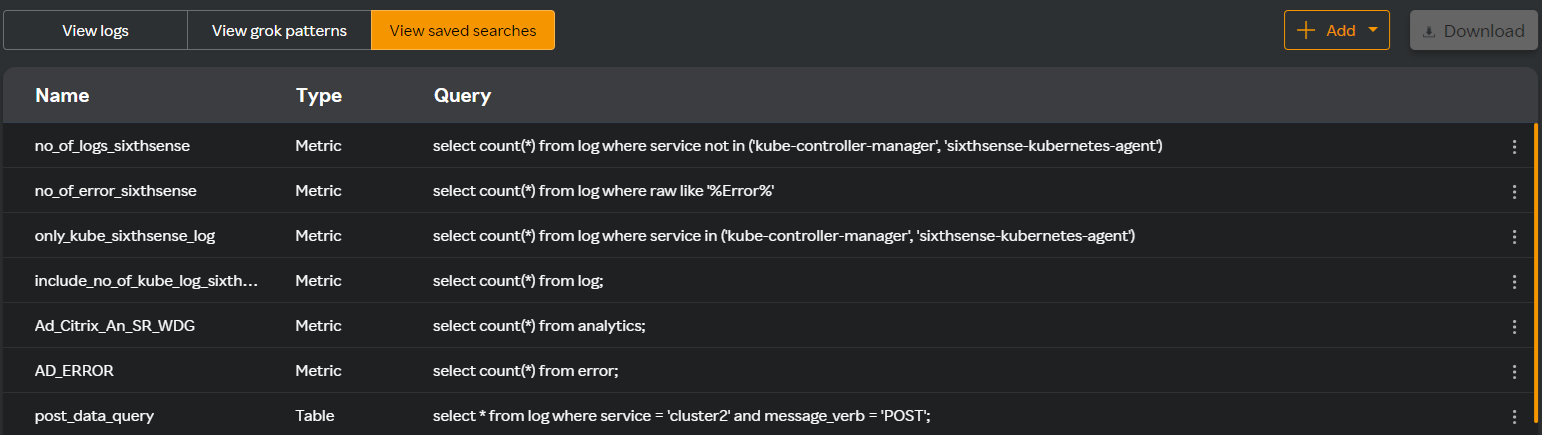
You can perform the following actions from this screen.
Editing the saved search
- Click the edit
 icon against the saved search name.
The Edit saved search window appears.
icon against the saved search name.
The Edit saved search window appears. - Modify the query in the Query pane.
- Click Validate to validate the query.
- Click Update.
Deleting the saved search
- Click the delete
 icon against the saved search name.
The Delete saved search window appears.
icon against the saved search name.
The Delete saved search window appears. - Click Delete.
The corresponding alerts configured for this saved search will be deleted and the widgets will have no data.
Running a query
- Click the run query
 icon against the saved search name.
The query associated with the saved search runs and the query appears in the query pane. The associated field appears under Fields in the left column along with the field details in the middle pane.
icon against the saved search name.
The query associated with the saved search runs and the query appears in the query pane. The associated field appears under Fields in the left column along with the field details in the middle pane.
Adding a widget
- Click the add widget
 icon against the saved search name.
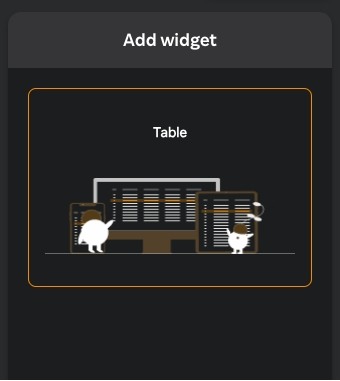
If the query type is table, you will get a table widget option in the right pane as in the following screen.
If the query type is metric, you will get a graph or label widget option in the right pane as in the following screen.
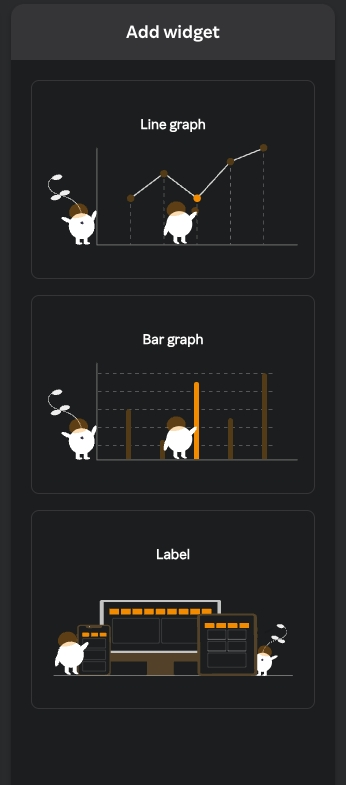
- Click the widget type you want to add in the right pane.
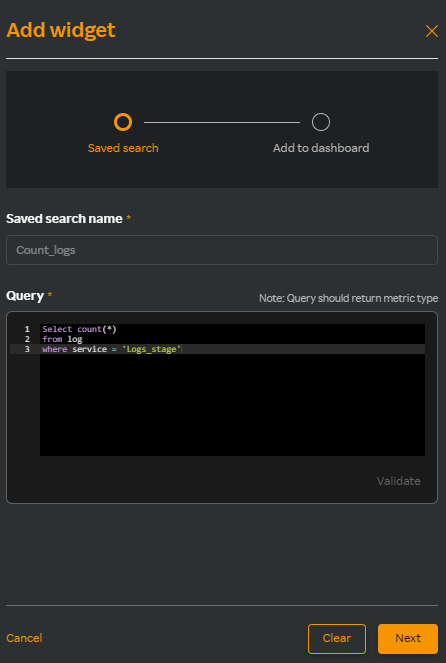
- In the Add widget window the following details appear.
| Field | Description |
|---|---|
| Saved search name | The search name you have selected appears by default. |
| Query | The query saved against the saved search name appears by default. |
- Click Next. The following screen appears.
Do any of the following.
a. Click Existing dashboard to select from an existing dashboard.
b. Click New dashboard to create a new dashboard.
Enter the following details if you have selected Existing dashboard in step a.
| Field | Description |
|---|---|
| Widget name | Name for the widget |
| Select dashboard | Select an existing dashboard |
- Enter the following details if you have selected New dashboard in step b.
| Field | Description |
|---|---|
| Widget name | Name for the widget |
| Dashboard name | Select the new dashboard name. |
| Copy template | Select a template from an existing dashboard. |
- Click Create.
The new dashboard you have created appears under the Select dashboard drop-down list in the Rakuten SixthSense Observability home page. For more information about the Log Monitoring dashboard, see Log monitoring dashboard.
Viewing alerts
- Click the view alerts
 icon against the saved search name.
You can view any existing alerts or create a new one. For more information about creating alerts for logs, see Log monitoring alerts.
icon against the saved search name.
You can view any existing alerts or create a new one. For more information about creating alerts for logs, see Log monitoring alerts.