ActiveMQ dashboard
- Navigate to MQ monitoring on the left pane in the Observability portal. By default, the Overview tab is selected.
- Select Active MQ from the Message queue drop-down list.
- Select a service from the Service name drop-down list.
- Select a broker from the Broker drop-down list.
The following screen is displayed.
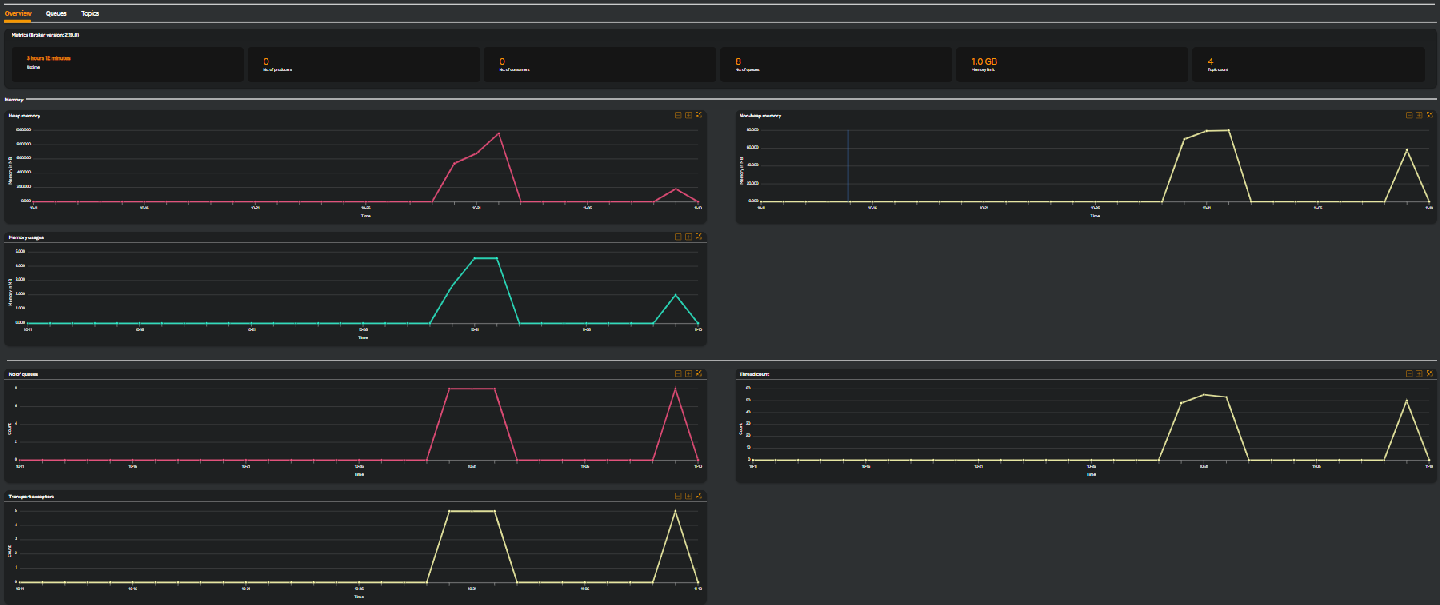
The top pane displays the following cards.
| Card name | Description |
|---|---|
| Uptime | The time that the instance has been up and running. |
| No. of producers | Number of producers sending messages. |
| No. of consumers | The number of consumers connected to ActiveMQ. |
| No. of queues | Number of queues created on this ActiveMQ server. |
| Memory limit | Maximum memory limit. |
| Topic count | The count of topics i.e published messages sent to all subscribers. |
The following widgets are available for you to comprehend metrics in a graph format.
| Widget name | Description |
|---|---|
| Heap memory | Heap memory allocated to JVM. |
| Non-heap memory | Non-heap memory allocated to JVM other than heap memory. |
| Memory usages | The memory used. |
| No. of queues | Number of queues created on this ActiveMQ server. |
| Thread count | The number of threads. |
| Transport acceptors | An acceptor defines a way in which connections can be made to the Apache ActiveMQ Artemis server. |