Broker
- Navigate to MQ monitoring on the left pane in the Observability portal.
- Select Kafka from the Message queue drop-down list.
- Click Broker to view the broker related details. A screen similar to the following appears.
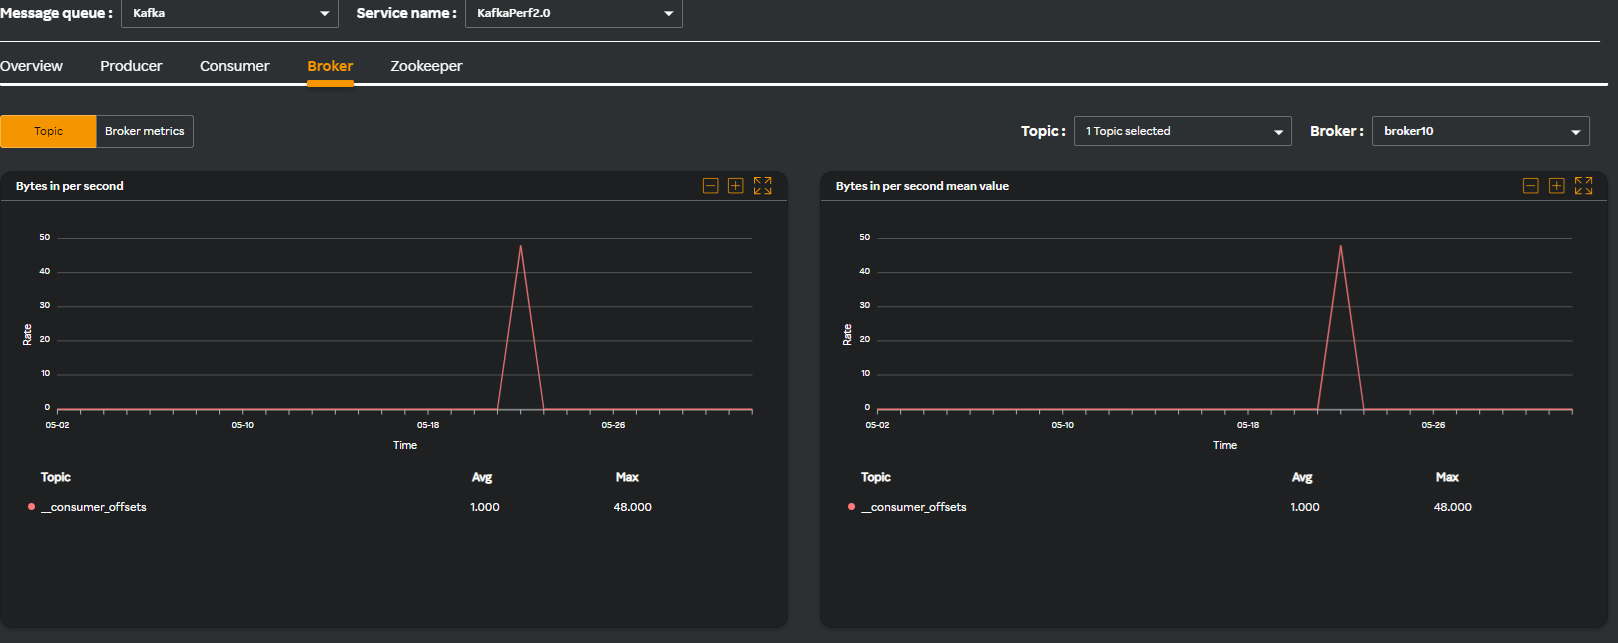
By default, the Topic tab under it is selected similar to the following screen. the following widgets are available for you to comprehend metrics in a graph format.
| Widget name | Description |
|---|---|
| Bytes in per second | Rate at which data is received or ingested into a specific topic in Kafka. |
| Bytes in per second mean value | Average value of bytes in (per second) over a given time period. |
| Bytes out per second | Total amount of data sent or transmitted (per second) out of a Kafka broker or cluster. |
| Bytes out per second mean value | Average value of bytes out (per second) over a given time period. |
| Message count | The cumulative number of messages that have been produced to the topic since its creation. |
- Click the Broker metrics tab. It contains the following widgets which lets you comprehend the metrics in a graph format.
| Widget name | Description |
|---|---|
| JVM CPU | Identifies CPU usage patterns for resource optimization. |
| JVM memory | Understand CPU usage patterns for resource optimization. |
| GC time | understand GC behavior, optimizing JVM settings and so on related to garbage collection. |
| GC count | Garbage collection count across different garbage collectors in Kafka. |
| Thread count | Understand thread utilization, optimizing concurrency settings and so on related to thread management. |
| Message count | Understand message throughput, topic activity, and optimize Kafka configurations for performance. |