Viewing logs
You can toggle between viewing logs, grok patterns, and saved searches. Use the following procedure to view logs. For viewing grok patterns, see Viewing grok patterns and for viewing saved searches, see Viewing saved searches.
- Click View logs to view the list of logs.
note
By default View logs is selected when you click Log monitoring from the Observability portal.
Select the service/log name/field from the list under Services/Log names/Fields in the left pane.
Click the
 icon next to the logs to expand the log details for Services/Log names/Fields. Following is an example of service log details.
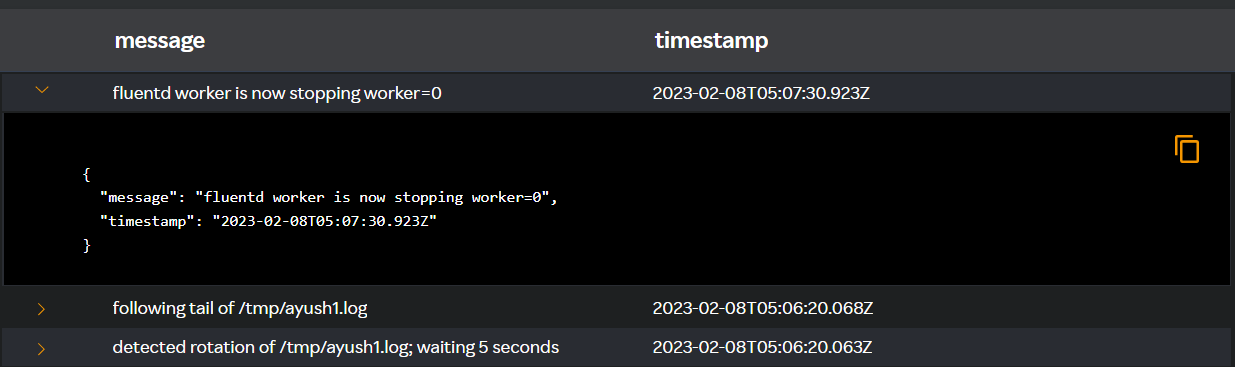
Click the
 icon to copy the log details.
Click Download to download the logs to a .csv file.
note
You can select only 5 fields that will be displayed as columns in the Viewing logs/grok patterns pane.