Kubernetes Monitoring Dashboard
Use the Kubernetes Monitoring dashboard to view the various details of a selected cluster.
- Navigate to Kubernetes monitoring from the left pane in the Observability portal.
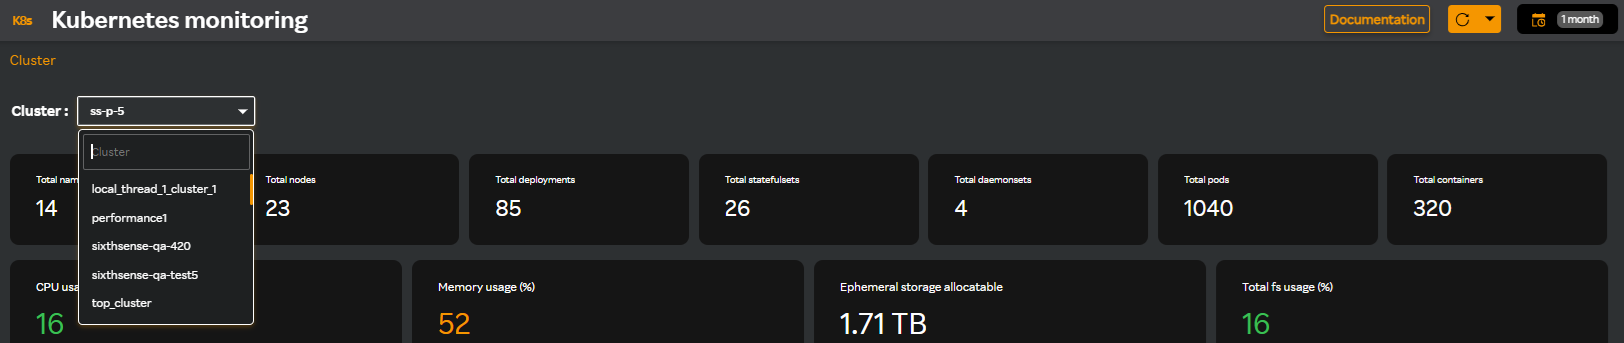
- Select the Kubernetes cluster name from the Cluster: drop-down list as in the following screen.
The Kubernetes dashboard displays all the data related to a selected cluster as in the following screen. You can view the details of the various types of resources used for deploying applications.
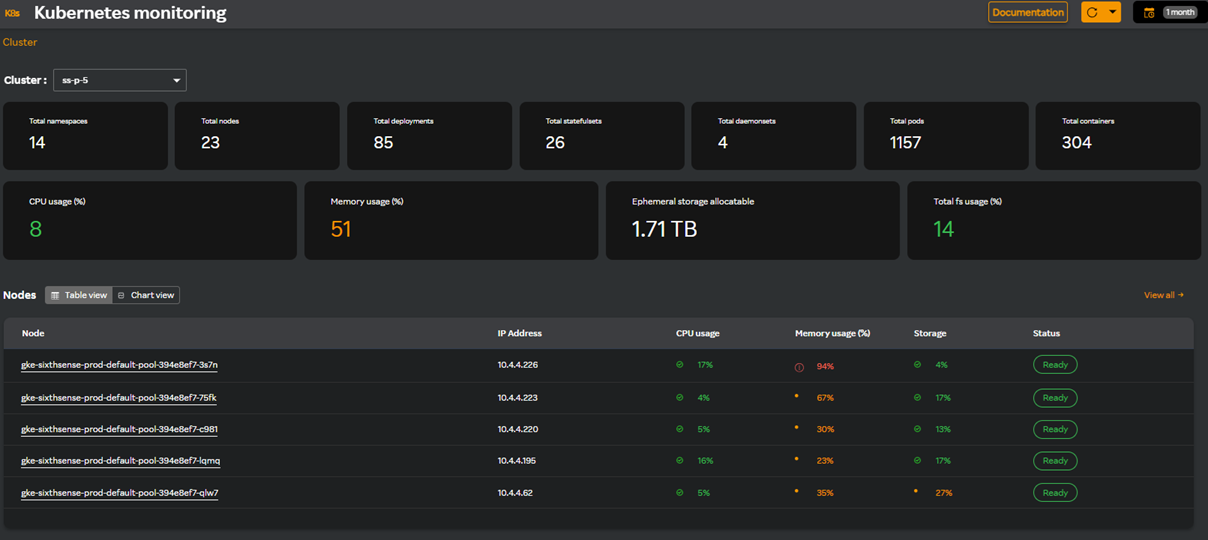
The top panel displays the total count for the different types of resources used to manage and deploy applications for the selected cluster as in the following screen.

- Total namespaces
- Total nodes
- Total deployments
- Total statefulsets
- Total daemonsets
- Total pods
- Total containers
The second top panel displays the usage and storage of metrics as in the following screen.

The following metrics are displayed percentage wise.
| Metrics | Description |
|---|---|
| CPU usage (%) | The utilized CPU resources by containers running within Kubernetes pods in percentage. |
| Memory usage (%) | The amount of memory resources consumed by containers running on Kubernetes nodes in percentage. |
| Ephemeral storage allocatable | The allocatable ephermeral storage which is a temporary storage that is attached to a pod's container. |
| Total fs usage (%) | The total usage of storage space being used within a container's filesystem. |
You can also view the following types of resources used to manage and deploy applications in Kubernetes as cards on the dashboard which are explained in the following sections.