Synthetic Endpoint Monitoring Dashboard
Synthetic endpointmonitoring is a feature provided by SixthSense Observability to proactively monitor browser applications and the availability of endpoints.
Performance monitoring is conducted using a synthetic user to test the performance of the web application during any time of the day. Different user journeys can be recorded and replicated as a test and is conducted to check the flow for issues that can impact a real user. Synthetic endpoint monitoring is becoming a hot feature for its ability to reduce the negative impact that it can have over the real user experience.
Endpoint availability is the feature that enables you to check the availability (in percentage), downtime (in days, hours, mins), and average response time (in ms) of custom endpoints that you configured. Along with the availability percentage, this feature also provides the summary of each ping so that you have the visibility into the failures occurred in the pings.
Applications
The Applications tab is enabled for users who have registered an application that must be monitored synthetically. You can create a test case using the SixthSense Test Acceleration Platform to emulate the end-user interaction with the application and our synthetic endpoint monitoring agents collect the performance metrics of the monitored applications.
Dashboard
By default, the Dashboard tab is selected and the following widgets are displayed.
Metrics widget
You can view the following monitored metrics (web core vitals) in the Metrics widget.
| Metrics | Type |
|---|---|
| Time to first byte | Time |
| DOM analysis time | Time |
| First paint time | Time |
| Page load time | Time |
| Content transfer time | Time |
| Error | Integer |
| First meaningful pain time | Time |
| TCP time | Time |
| Redirect time | Time |
| Time to interact | Time |
Pages widget
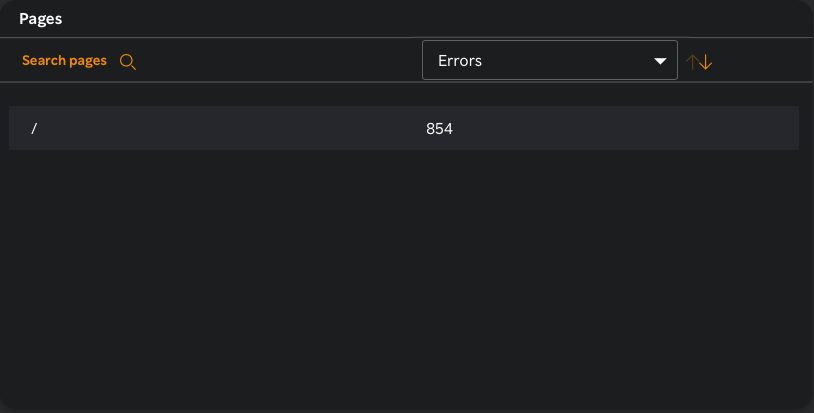
Metrics are monitored for all the pages in the application from which the metrics can be obtained. This widget shows individual metrics for each page so that they can be compared and the focus can be shifted on the pages with poor metrics time.
While viewing the number of errors, the user can navigate to the Errors tab by clicking on the integer value (854 in the image below) to view the errors that occurred during the synthetic tests.

Website availability widget
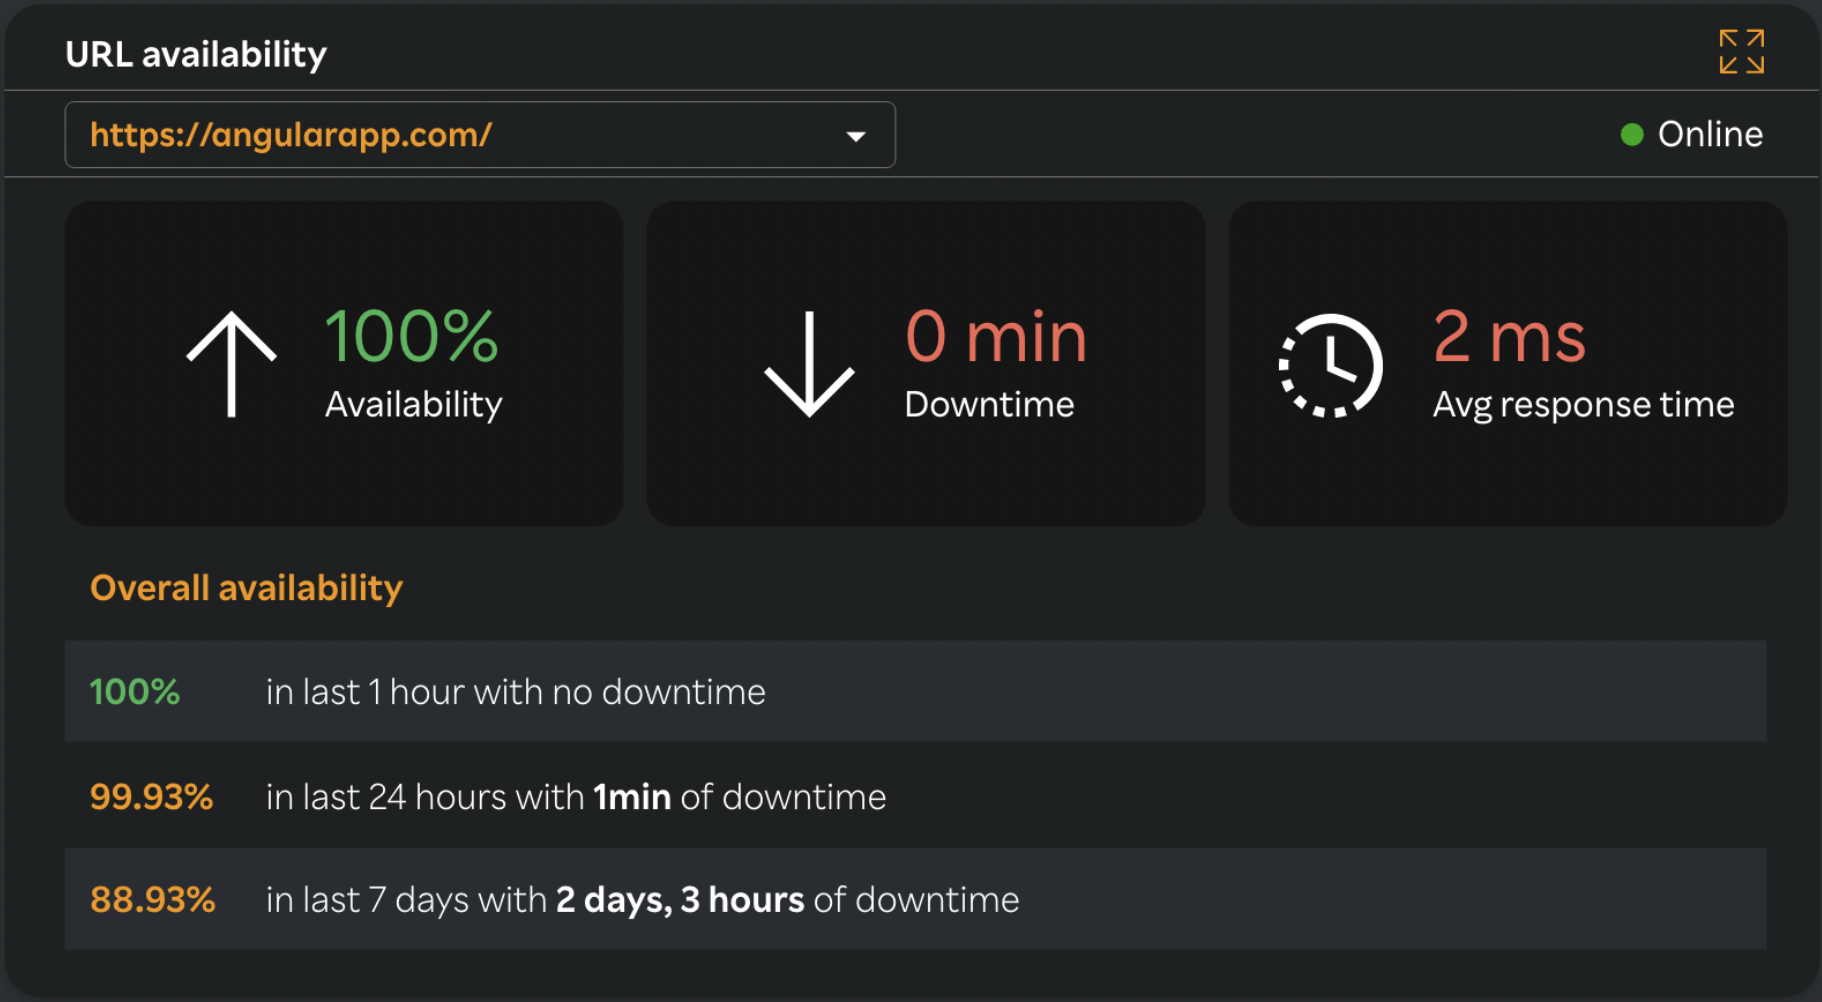
This widget shows the availability and downtime of the URL of the application being monitored. The URL is obtained automatically by the installed agent and health checks are done without any configuration.

Click the expand ![]() icon on the top right corner to view details. You can also view more details about the availability in the following widget.
icon on the top right corner to view details. You can also view more details about the availability in the following widget.
Summary widget
Details of every ping made to check website availability is provided in the Summary widget. This includes success or failure of the ping attempt, request, response, and connection details which you can copy and download.
KPM
The KPM dashboard displays the metrics with customised colour formatting that helps the user to judge the state of metrics at a glance. Three different colours define the criticality of the metrics.
- Red: Poor state
- Amber: Fair state
- Green: Good state
The user can define these states by adding a KPM (Key Performance Metrics) under KPM tab.
Adding KPMs
- Go to Synthetic monitoring on the left pane.
- Select an application from the Select application: drop-down list.
- Click the KPM tab.
- Click Add KPM.
- Select the following values in the Add Key Performance Metric window.
| Fields | Action |
|---|---|
| Application selected | The application you selected earlier is available by default. |
| Metric | Select the monitored metrics from the drop-down list. |
| Operator 1 | Select the condition for good state from the drop-down list. |
| Operator 2 | Select the condition for for poor state from the drop-down list. |
| Threshold 1 | Enter the value to define a good state. |
| Threshold 2 | Enter the value to define a poor state. |
- Click Add.
Note: You can edit or delete these defined states as per the seasonal deviations. Click the edit icon or the delete
icon to edit or delete the defined states from the KPM dashboard under the Action column.
Errors
All the errors that occur while synthetically testing the application are listed under the Errors tab. Each error can have multiple occurrences or events. This screen displays the Error name, Events, and Last occurred columns.
Viewing all events for an error
- Navigate to Synthetic monitoring > Errors.
- Click the events
 icon under Events column. All the events for a particular error are displayed.
 - Click the Event ID to drill down into the event and view application details, stack trace, breadcrumbs, SDK and user agent.
Sometimes, the cause of the frontend error can be a backend fault. SixthSense Observability's correlation capability allows a synthetic endpoint monitoring frontend error to be traced in APM for a backend failure. To do so, click the APM trace ![]() icon next to the Event ID.
icon next to the Event ID.
You can navigate to the APM > Trace page where the backend error trace can be viewed. This feature is only available if you have a license to both SixthSense APM and Synthetic endpoint monitoring.
Endpoints
Synthetic endpoint monitoring also provides availability checks for custom URLs without the use of agents. You can configure a custom URL by either uploading a postman collection or manually entering the configuration details. You can group these endpoints under a group and can view the overall status as the aggregated state of all the metrics.
Viewing groups
- Navigate to Synthetic monitoring > Endpoints. The Availability tab is selected by default.
- Click All groups tab. Information related to the groups is available.
- Select the Avg health Status drop-down list and select the status you want to view.
- Sort by Group name, Avg health Status, and Number of endpoints from the Group name drop-down list.
- Click the
 icon to delete or add endpoint to the group.
Creating and adding an endpoint to a group
- Navigate to Synthetic monitoring > Endpoints. The Availability tab is selected by default.
- Click Create group.
- In the Create group window, enter a group name in the Group name field.
- Click Create group.
- Click Add endpoint to the group to check the endpoint availability.
- In the Add endpoint window, select the group from the drop-down list to which you want to add the endpoint.
- Upload postman collection by either uploading it or dragging and dropping the JSON file.
- Click Save endpoint.
Deleting an endpoint
- Navigate to Synthetic monitoring > Endpoints. The Availability tab is selected by default.
- Click All endpoints. All the endpoints are listed.
- Click the
 icon visible at the end of the endpoint row you want to delete.
 - Click Delete.
For each configured endpoint, a synthetic test (similar to the above defined tests) can be created and scheduled multiple times as jobs. The reports for these tests define the success/failure and total time taken for each test step.
With these capabilities, Synthetic endpoint monitoring can proactively ensure that your web application is not affecting the real-user experience by providing you with the visibility into performance, errors, and availability.